PortfolioMetrics vs. Nitrogen
¿La mejor opción para informes de inversión profesionales?
Los asesores financieros se están alejando cada vez más de las costosas plataformas empresariales en favor de herramientas de diagnóstico ágiles y orientadas a los datos. Mientras que Nitrogen (antes Riskalyze) ha sido durante mucho tiempo la plataforma de referencia para propuestas comerciales centradas en el riesgo, PortfolioMetrics se ha consolidado como una gran alternativa para asesores que necesitan análisis cuantitativo profundo e informes PDF profesionales a una fracción del coste.
Esta comparación explica por qué muchos asesores están pasando a PortfolioMetrics para sus necesidades de revisión de clientes e informes.
| PortfolioMetrics | Nitrogen | |
|---|---|---|
| Enfoque principal | Backtesting cuantitativo y optimización | Alineación de riesgo y apoyo a ventas |
| Precio principal | $46.90 / month (Professional) | $250 - $450+ / month (Standard/Elite) |
| Compromiso | Mensual (cancela cuando quieras) | Contrato habitual de 12 meses |
| Medición de métricas | Métricas cuantitativas estándar del sector | Marcos de riesgo propietarios y con marca registrada |
| Métricas utilizadas | Volatilidad, Drawdown, VaR, CAGR, Sharpe, Sortino, etc. | Risk Number®, 95% Historical Range™, GPA® |
| Optimización de cartera | Métodos estándar del sector como media-varianza, Risk Parity, enfoques con restricciones y basados en objetivos | Se centra en alinear carteras con un nivel de riesgo objetivo |
| Informes PDF | Análisis técnico completo y personalizable | Report Builder (IPS, Snapshot, Stats) |
| Ideal para | Inversores y asesores que buscan un análisis de cartera cuantitativo y transparente, y evaluación de estrategias | Asesores que priorizan la comunicación estandarizada del riesgo y la alineación con el cliente |
1. Client Reporting: Narrative vs. Deep Analysis
Nitrogen: The "Sales" Story
Nitrogen’s PDF reports are built around the Risk Number® and the 95% Historical Range™. The goal is to simplify the conversation to a single number between 1 and 99. While excellent for "visual storytelling" and client acquisition, some advisors find the reports lack the statistical depth required for sophisticated clients or institutional-level reviews.
PortfolioMetrics: The "Quantitative" Analysis
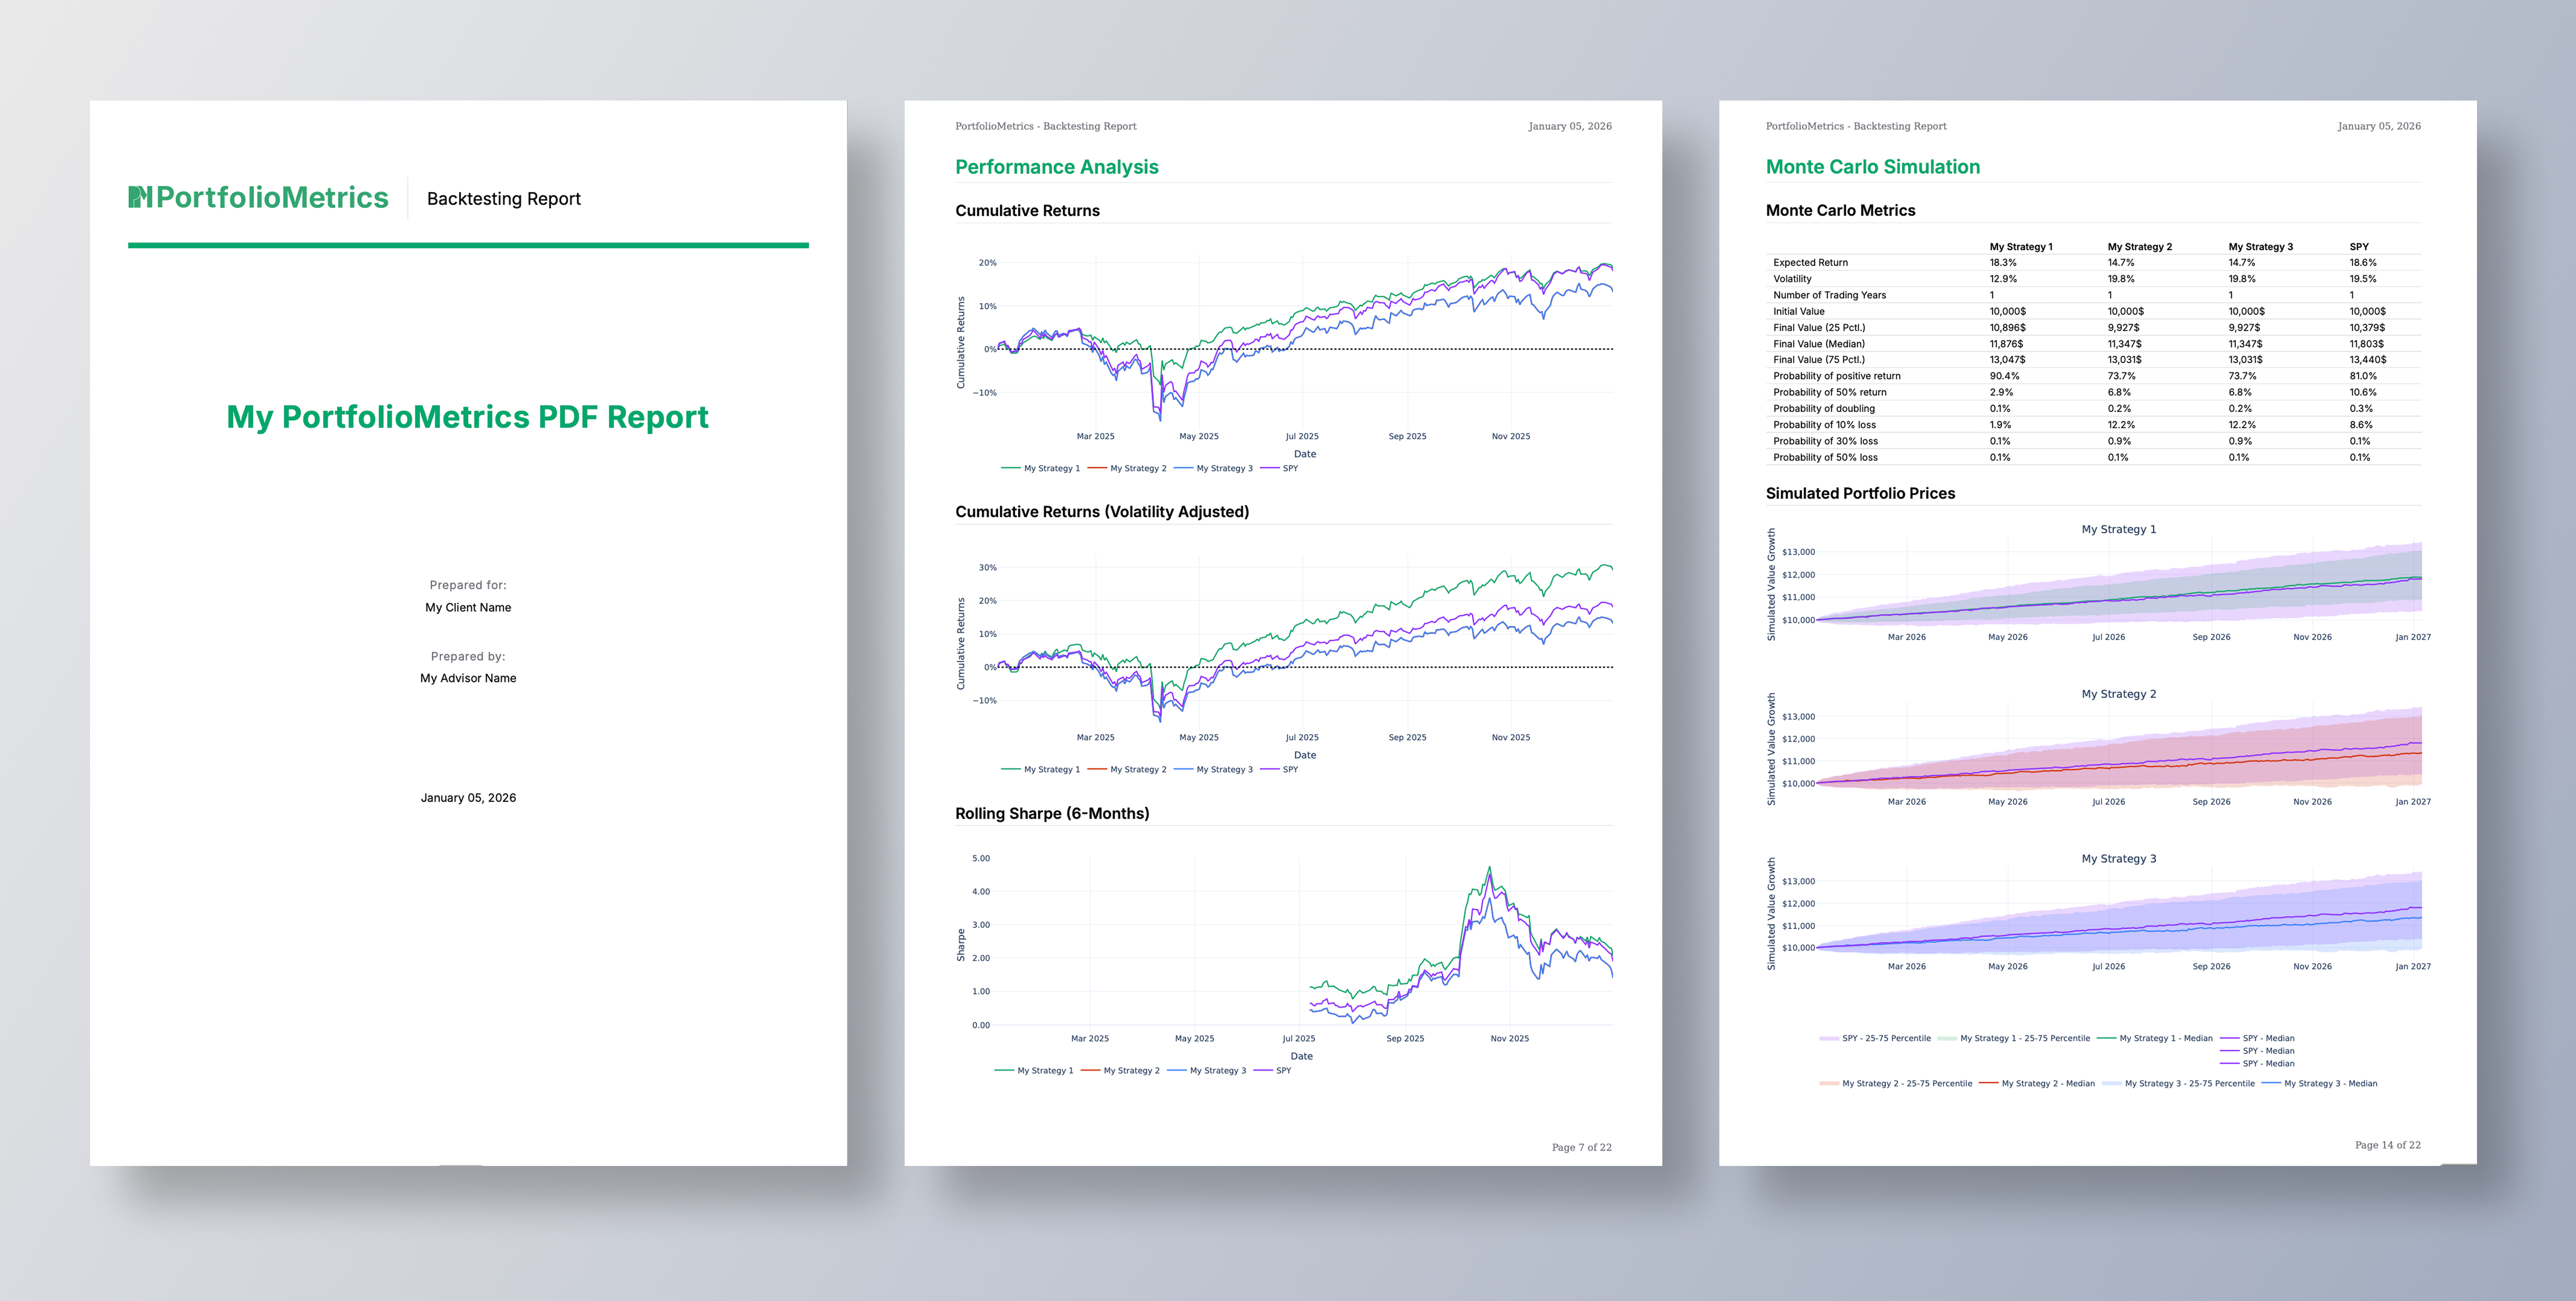
PortfolioMetrics provides high-resolution PDF reports that focus on Strategy Validation. Our reports include:
- 40+ Years of Backtesting: Show how a strategy performed through the '87 crash, the Dot-com bubble, and 2008 housing market crash.
- Monte Carlo Simulations: Forecast price developments over 50 years to stress-test long-term goals.
- Risk-Adjusted Metrics: Professional-grade statistics like the Serenity Ratio, UPI, Sortino Ratio, and Recovery Factor to prove the quality of your management.
- Efficient Frontier Mapping: Visually demonstrate to clients that their portfolio is optimized for the highest possible return at their given risk level.
2. Branding and Customization
Both platforms recognize that a report should reflect your firm, not the software provider's.
- Nitrogen Branding: Custom colors and logos are available, but typically require the higher-tier Ignite or Ultimate plans.
- PortfolioMetrics Branding: Professional PDF reporting with your custom title, your client name and your own name.
3. The Cost Gap
The most significant difference between the two platforms is the economic model. Nitrogen is an enterprise SaaS product designed for large firms with high overhead. PortfolioMetrics is a diagnostic utility designed for efficiency.
- Nitrogen Branding: A solo advisor can expect to pay approximately $3,000 to $5,400 per year for a full suite of reporting and research tools.
- PortfolioMetrics Advantage: For just $469 per year (Professional tier), you get high-quality PDF reports, deeper historical data, and more advanced optimization tools.
Advisors switching from Nitrogen to PortfolioMetrics typically save over 80% on their annual reporting software spend while increasing the technical rigor of their client deliverables.
4. Why Advisors are Switching
Key Switch Factors:
- No Contract Traps: Nitrogen often requires annual commitments that are difficult to exit. PortfolioMetrics offers total flexibility with monthly billing.
- Broader Asset Coverage: PortfolioMetrics includes high-quality data for US, EU, Latin American, and Asian markets, including UCITS ETFs, which is often a limitation in US-centric tools.
- Statistical Usefulness: Many advisors feel Nitrogen's Risk Number is a "sales tool" rather than a scientific measurement. PortfolioMetrics uses established, transparent methodologies like the Markowitz mean-variance model.
Conclusion: Which is right for you?
Choose Nitrogen if: You are a high-volume sales firm that needs a heavy focus on lead generation, CRM integrations, and a simplified "Risk Number" to close prospects quickly.
Choose PortfolioMetrics if: You are a professional advisor or analyst who values transparency, deep historical backtesting, and quantitative accuracy - and you want to provide professional, branded PDF reports without the enterprise price tag.


