
Why Risk-Adjusted Metrics Matter
Risk-adjusted metrics put portfolio performance into perspective. They don’t just show how much return a strategy delivers, but how efficiently it balances risk and reward to achieve it. This makes risk-adjusted performance comparable across different investment approaches.
Three Types of Risk-Adjusted Metrics
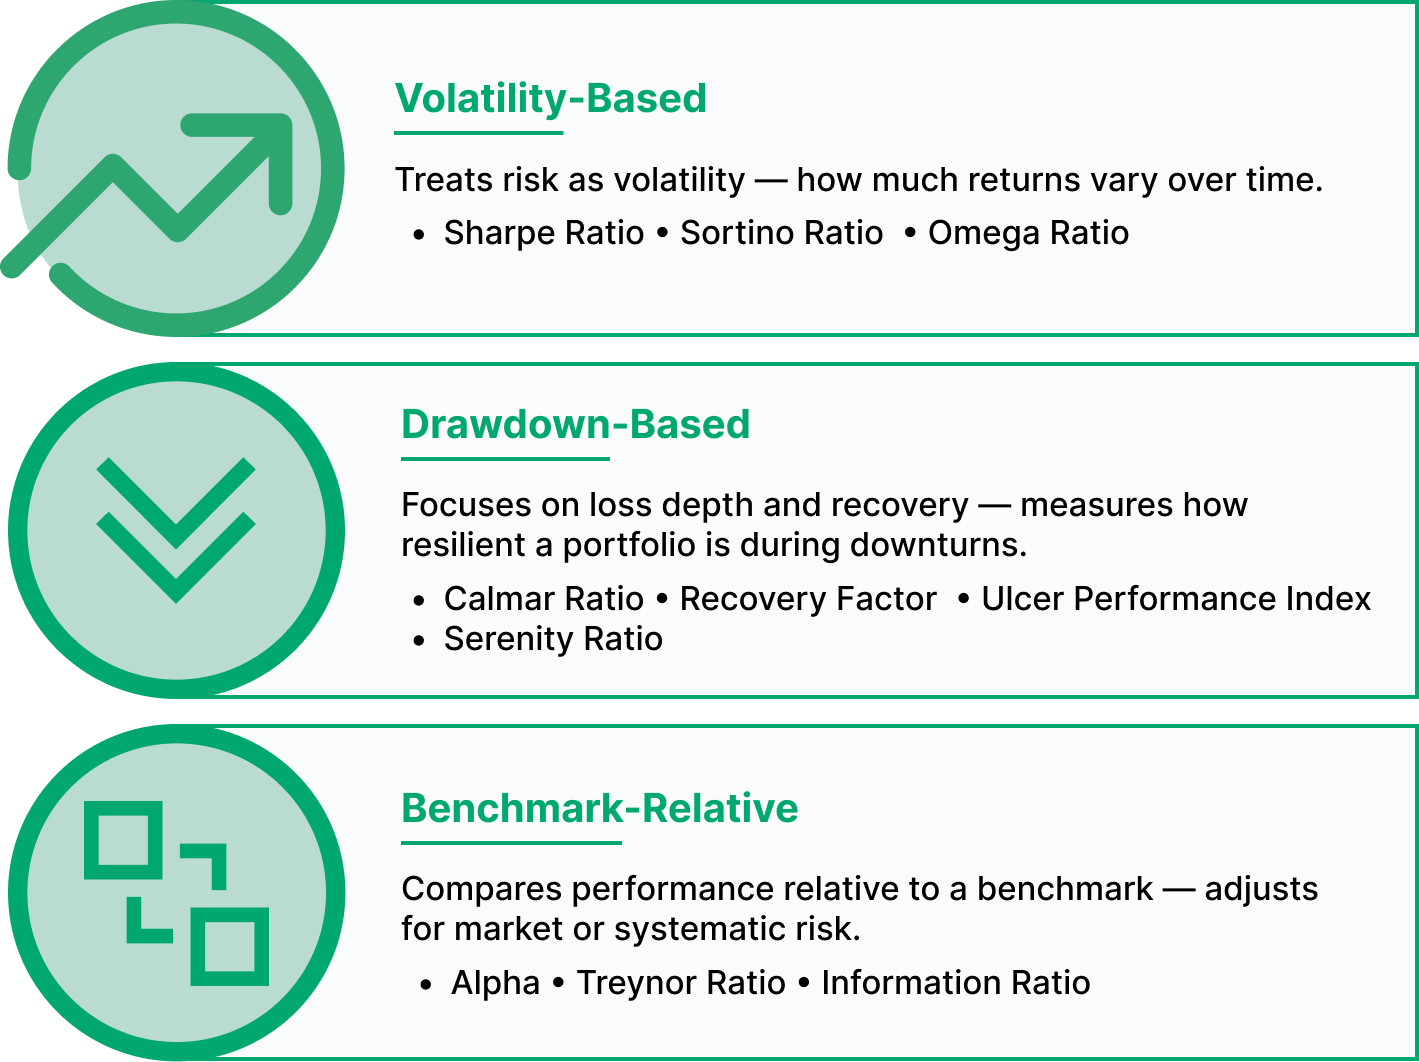
Different risk-adjusted metrics capture performance through different definitions of risk. Some focus on volatility, others on drawdowns, and others on how portfolios perform relative to a benchmark. Looking at all three gives investors a better view of portfolio efficiency and resilience.
The chart below visualizes these categories before we dive into each type. It highlights the key idea: every metric tells a different story about how returns are earned and how much risk was taken to achieve them.
Volatility-Based Metrics
These metrics treat risk as variability in returns and measure how efficiently a portfolio converts volatility into performance.
Sharpe Ratio
Definition: Measures excess return per unit of total volatility.
Formula: (Rp - Rf) / σp \ When to Use: To compare the overall efficiency of different strategies.
Sortino Ratio
Definition: Measures excess return per unit of downside volatility.
Formula: (Rp - Rf) / σd
When to Use: When downside risk matters more than total volatility.
Omega Ratio
Definition: Compares probability-weighted gains to losses beyond a target return.
Formula: Sum(gains > threshold) / Sum(losses < threshold)
When to Use: When return distributions are skewed or asymmetric.
Drawdown-Based Metrics
These focus on losses and recovery, emphasizing resilience during downturns.
Calmar Ratio
Definition: Measures annualized return relative to maximum drawdown.
Formula: CAGR / Max Drawdown
When to Use: To assess reward versus deep losses.
Recovery Factor
Definition: Compares total return to maximum drawdown.
Formula: Total Return / Max Drawdown
When to Use: To measure long-term recovery strength.
Ulcer Performance Index (UPI)
Definition: Evaluates return adjusted for the depth and duration of drawdowns.
Formula: (Rp - Rf) / Ulcer Index
When to Use: For investors prioritizing smooth, stress-free growth.
Serenity Ratio
Definition: Combines return, volatility, and drawdown to assess portfolio stability.
Formula: (Rp - Rf) / (σp × Ulcer Index)
When to Use: For a holistic measure of stable performance.
Benchmark-Relative Metrics
These compare portfolio returns to a market or benchmark, adjusting for systematic or active risk.
Alpha
Definition: Measures outperformance beyond what market exposure predicts.
Formula: Rp - (β × Rb)
When to Use: To assess skill-based excess returns.
Treynor Ratio
Definition: Compares excess return per unit of systematic risk.
Formula: (Rp - Rf) / βp
When to Use: For well-diversified portfolios with known beta.
Information Ratio
Definition: Measures active return relative to tracking error.
Formula: (Rp - Rb) / Tracking Error
When to Use: For active managers aiming for consistent outperformance.
Beta
Definition: Compares portfolio volatility to the market.
Formula: Cov(Rp, Rb) / Var(Rb)
When to Use: To understand how much a portfolio moves with the market.
How to Interpret Risk-Adjusted Metrics
| Metric | Good Value | What It Measures | When to Use |
|---|---|---|---|
| Sharpe Ratio | > 1.0 (good), > 2.0 (very good) | Return per unit of total volatility | Comparing overall efficiency of different strategies |
| Sortino Ratio | > 1.0 (good), > 2.0 (very good) | Return per unit of downside volatility | When drawdowns matter more than upside swings |
| Omega Ratio | > 1.0 (good), > 1.5 (strong) | Gains vs. losses beyond a set threshold | For skewed or asymmetric return profiles |
| Calmar Ratio | > 0.5 (acceptable), > 1.0 (strong) | Return relative to maximum drawdown | Assessing reward vs. deep losses |
| Recovery Factor | > 1.0 (baseline), > 2.0 (resilient) | Return relative to drawdown recovery effort | Measuring resilience over long drawdowns |
| Ulcer Performance Index (UPI) | > 1.0 (good), > 3.0 (very strong) | Return adjusted for drawdown depth & duration | Prioritizing smooth and stress-free growth |
| Serenity Ratio | > 0.5 (good), > 1.0 (very good) | Return adjusted for both volatility and drawdowns | Holistic view on stable growth |
| Alpha | > 0.0 (positive = outperformance) | Excess return vs. benchmark (CAPM-adjusted) | Measuring skill or market-beating performance |
| Treynor Ratio | > 0.5 (solid), varies with beta levels | Return per unit of systematic (beta) risk | For well-diversified portfolios |
| Information Ratio | > 0.5 (good), > 1.0 (excellent) | Excess return per unit of tracking error | Measuring consistency of active manager performance |
Case: Comparing Portfolio Strategies
To see how risk-adjusted metrics behave in practice, we ran a 10-year backtest from November 6, 2015 to November 6, 2025. Each portfolio started with an initial investment of $10,000, no additional cash flows, and dividends were fully reinvested throughout the period. No rebalancing was applied. The SPY (S&P 500) served as the benchmark for relative performance.
Portfolio Setup
| Portfolio | Asset Allocation |
|---|---|
| Three-Fund Portfolio | 33% VTI (US Total Market), 33% EFA (Developed International), 33% AGG (US Bonds) |
| Buffett’s 90/10 Portfolio | 90% SPY (S&P 500), 10% SHY (Short-Term Treasuries) |
| QQQ Portfolio | 100% QQQ (Nasdaq 100) |
| SPY (Benchmark) | 100% SPY (S&P 500) |
Key Risk-Adjusted Metrics (2015 – 2025)
| Metric | Three-Fund | 90/10 | QQQ | SPY |
|---|---|---|---|---|
| Sharpe Ratio | 0.73 | 0.84 | 0.90 | 0.83 |
| Sortino Ratio | 1.01 | 1.18 | 1.28 | 1.18 |
| Omega Ratio | 1.15 | 1.18 | 1.18 | 1.18 |
| Calmar Ratio | 0.35 | 0.43 | 0.55 | 0.43 |
| Recovery Factor | 3.68 | 4.47 | 5.75 | 4.46 |
| Ulcer Performance Index | 0.07 | 0.07 | 0.10 | 0.07 |
| Serenity Ratio | 0.63 | 1.27 | 1.01 | 1.30 |
| Alpha | –0.01 | 0.00 | 0.03 | – |
| Treynor Ratio | 0.14 | 0.15 | 0.18 | – |
| Information Ratio | –0.86 | –0.62 | 0.61 | – |
Three-Fund Portfolio
Strengths:
-
Solid defensive characteristics: Sharpe (0.73) and Sortino (1.01) both exceed “good” thresholds (> 0.5 and > 1.0).
-
The Recovery Factor (3.68) and Calmar (0.35) confirm steady but moderate efficiency under stress.
-
Diversification across stocks and bonds reduces volatility (12.8%) and max drawdown (–25.2%).
Weaknesses:
-
UPI (0.07) reflects very low efficiency relative to drawdown risk, far below what is considered “good”.
-
Modest Calmar and Serenity (0.63) suggest less reward per unit of drawdown.
-
Lagging Information Ratio (–0.86) reflects weak consistency versus the benchmark.
Benchmark-Relative:
- Slight negative Alpha (–0.01) and low Treynor (0.14) indicate underperformance per unit of systematic risk.
Verdict:
Balanced, globally diversified, and low-maintenance, deal for long-term investors prioritizing stability over aggressive alpha.
Buffett’s 90/10 Portfolio
Strengths:
-
Across-the-board improvement versus the Three-Fund: Sharpe (0.84), Sortino (1.18), and Omega (1.18) all within the “very good” zone.
-
Drawdown metrics improved: Calmar (0.43) and Recovery (4.47) highlight better downside resilience.
-
Volatility (16.9%) and Max Drawdown (–31.7%) remain controlled for an equity-heavy mix.
Weaknesses:
-
UPI (0.09) remains weak in absolute terms, meaning the strategy’s drawdowns are still large relative to its return.
-
Serenity (1.27) is healthy but not exceptional relative to SPY.
-
Still no persistent Alpha (0.00) and slightly negative Information Ratio (–0.62).
Benchmark-Relative:
- Treynor (0.15) and Beta (0.94) show efficient market exposure without excess leverage.
**Verdict:
**A pragmatic middle ground, higher returns than the Three-Fund, lower risk than QQQ. Fits investors seeking simplicity with moderate growth bias.
QQQ Portfolio
Strengths:
-
Outstanding across key ratios: Sharpe (0.90), Sortino (1.28), Omega (1.18), all exceeding strong thresholds.
-
Drawdown metrics are superior: Calmar (0.55), Recovery (5.75), Serenity (1.01).
-
Highest Alpha (+ 0.03) and positive Information Ratio (+ 0.61) show consistent outperformance.
Weaknesses:
-
UPI (0.11) is still weak in absolute terms, showing that QQQ’s strong returns come with meaningful drawdown stress.
-
Elevated volatility (22.4%) and drawdown (–35.1%) require conviction and tolerance for fluctuations.
-
Tech concentration adds cyclical risk.
Benchmark-Relative:
- Beta (1.16) indicates higher systematic risk, yet Treynor (0.18) confirms excellent compensation per risk unit.
Verdict: The top performer in this period, delivering both higher returns and strong risk-adjusted efficiency. Best for long-term investors comfortable with volatility and sector concentration.
SPY (Benchmark)
Strengths:
-
Consistent performer across metrics: Sharpe (0.83), Sortino (1.18), and Omega (1.18) all solidly “good.”
-
Serenity (1.30) stands out, showing stability across volatility and drawdown dimensions.
Weaknesses:
-
UPI (0.10) remains low, reinforcing that SPY’s long-term drawdowns materially reduce its drawdown-adjusted efficiency.
-
Limited diversification: SPY is focused on U.S. large-cap stocks and doesn’t include international equities, small caps, or bonds.
-
Delivers strong efficiency, but both QQQ and the 90/10 portfolio achieved slightly higher risk-adjusted returns.
-
No alpha since it serves as the benchmark.
**Verdict:
**A reliable benchmark representing efficient U.S. equity exposure. Best used as a reference or core equity component rather than a full portfolio.
Final Thoughts
Risk-adjusted metrics are among the most reliable tools for comparing portfolio performance. They go beyond simple returns to show how efficiently each strategy converts risk into reward. Metrics like the Sharpe Ratio, Sortino Ratio, and Calmar Ratio quantify balance, recovery, and consistency, the core pillars of sustainable investing.
Across the 10-year period, QQQ still led most metrics, driven by strong returns and solid recovery factors. Yet, its higher volatility and sector concentration show the trade-off behind its outperformance. The 90/10 portfolio followed closely, offering a better balance of growth and risk control, while the Three-Fund Portfolio demonstrated resilience and smoother behavior, proving its strength as a globally diversified base.
SPY, as the benchmark, remains a dependable representation of U.S. equity exposure but lacks the diversification of the other models. Its role in this comparison highlights that even well-known benchmarks don’t necessarily deliver the best risk-adjusted performance.
Ultimately, no single number can capture what truly matters: your goals, time horizon, and ability to stay invested through market swings. Risk-adjusted metrics offer perspective - not answers. The best portfolio is the one whose risk profile you can live with, not just the one that tops the charts.
To explore how different strategies behave, you can experiment with a few well-known models using our Popular Portfolios page.


