Investments are a balancing act between risk and return. In this constantly changing landscape, it is difficult to analyze and make investment decisions. However, one tool that has proven to be a useful guide is the Markowitz Mean-Variance model and its graphical representation — the Efficient Frontier.
The concept was developed in 1952 by Nobel Prize winner Harry Markowitz and is a cornerstone of modern portfolio theory (MPT). Markowitz showed that the risk of an investment portfolio is not determined by the average risk of the underlying assets, but by the extent to which they move together — their correlations. Diversifying a portfolio across imperfectly correlated assets allows investors to increase their expected returns without increasing their risk. Or reduce their risk without reducing their expected returns. Markowitz argued that diversification is the only free lunch in investing, since increasing expected returns usually requires taking on more risk.
This article breaks down the efficient frontier and explains how you can use our free dashboard to achieve a practical application for your investment strategy. In addition, the criticisms of the method are described.
What is the efficient frontier?
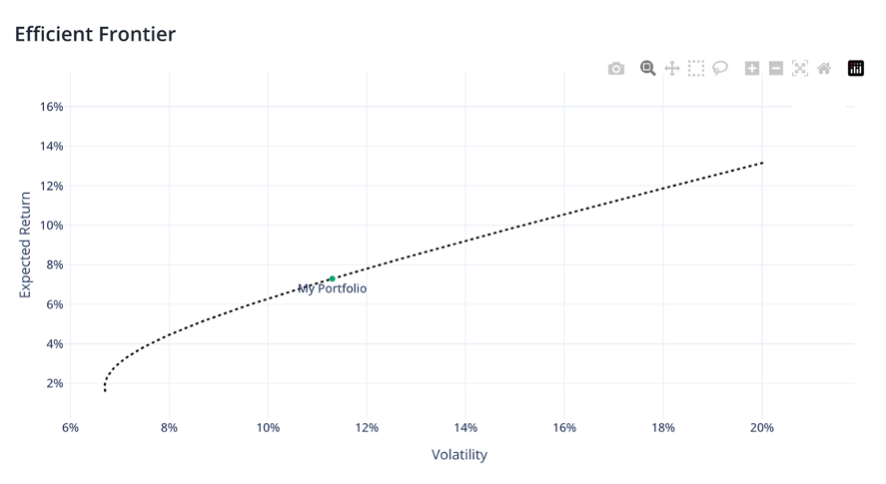
The efficient frontier evaluates portfolios on a coordinate plane. The risk is plotted on the x-axis, while the return is plotted on the y-axis. Three important factors are considered to calculate the efficient frontier:
-
Expected return of individual assets (we estimate the expected return as an annualized return using the arithmetic average)
-
Risk of individual assets (we calculate the annualized volatility, i.e. the standard deviation of the asset price on an annual basis)
-
Sharpe Ratio of individual assets (by comparing the excess performance returns with the total standard deviation of the portfolio, we calculate the risk-adjusted performance)
The individual formulas can be viewed here.
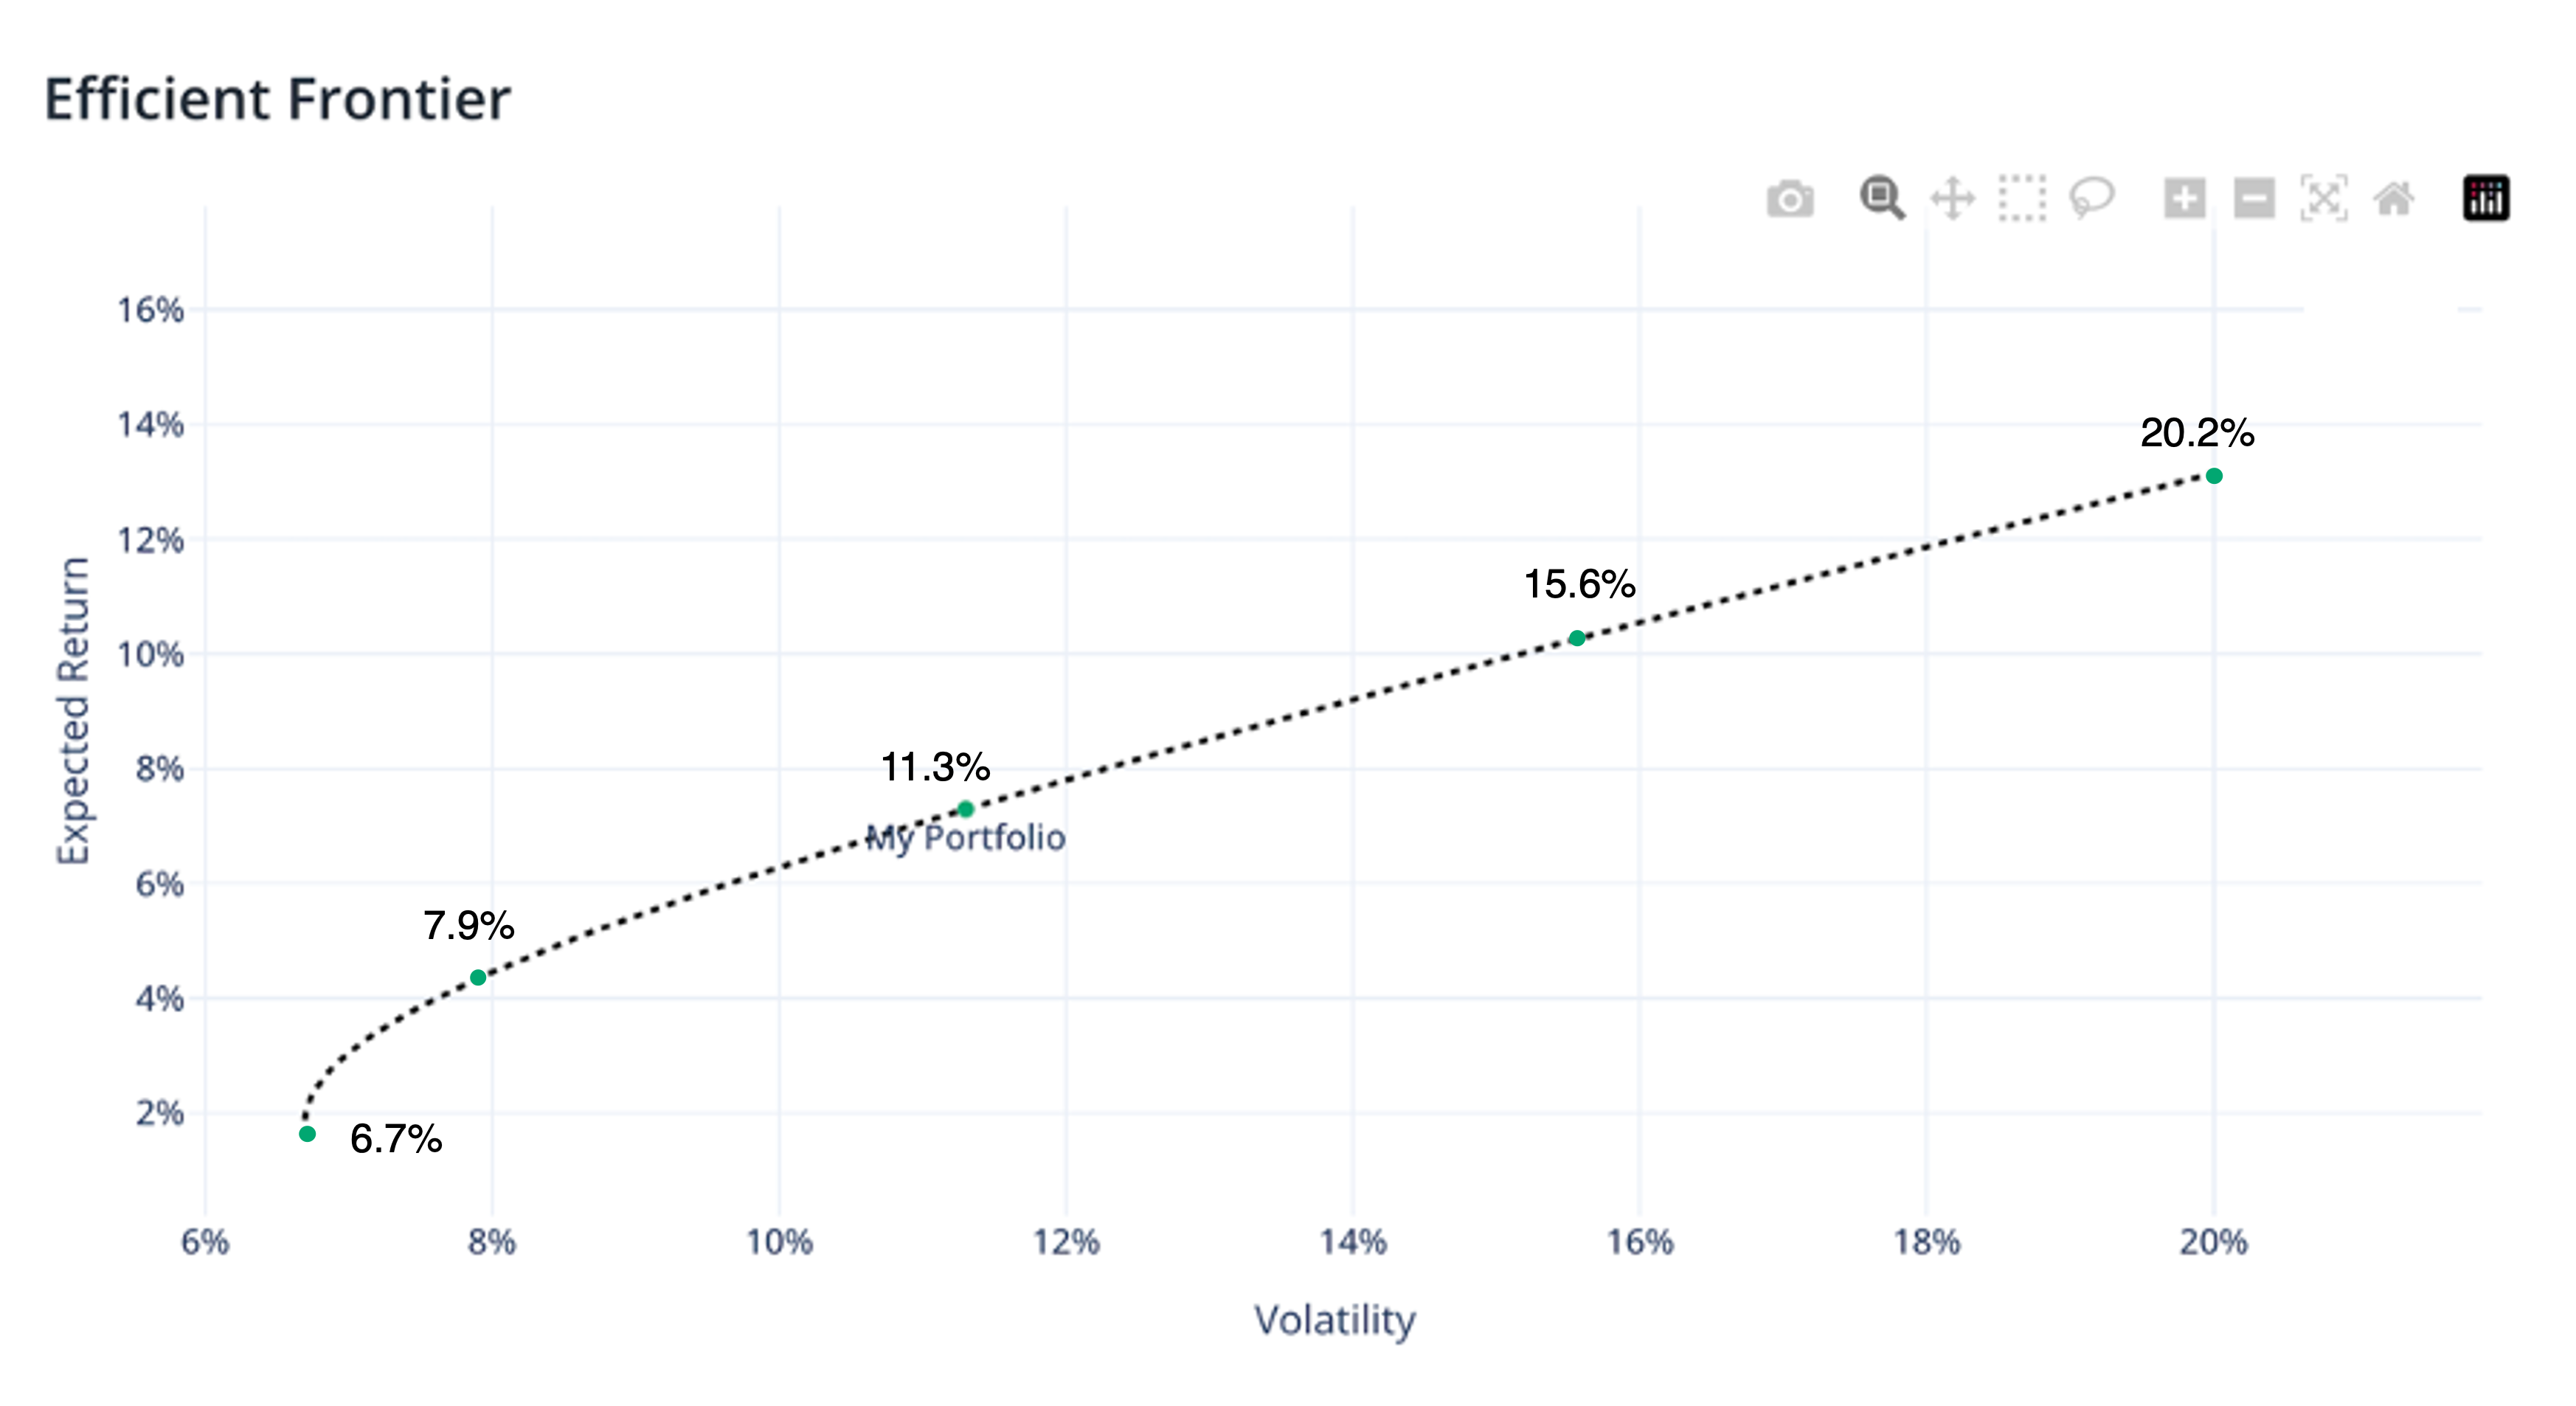
The efficient frontier graphically represents portfolios that maximize the return for the risk taken and highlights the opportunities for diversification. To take advantage of the efficient frontier, a risk-averse investor will choose investments that are more to the left. A risk-taking investor, on the other hand, would choose investments that are more to the right.
What does the practical application look like?
As a practical example, we use one of the popular portfolio strategies: the two-fund portfolio, which consists of two assets.
-
Asset A: Vanguard Total Bond Market Index Fund (BND)
-
Asset B: Vanguard Total World Stock Index Fund (VT)
and calculate the risks and returns as well as the Sharpe Ratio.
| Particulars | Asset A: Vanguard Total Bond Market Index Fund (BND) | Asset B: Vanguard Total World Stock Index Fund (VT) |
|---|---|---|
| Expected Return | 1.3% | 13.3% |
| Volatility | 6.8% | 20.2% |
| Sharpe Ratio | 0.190 | 0.658 |
Let us now give weights to the assets to demonstrate the portfolio in different allocations:
| Portfolio | Asset A: (BND) Allocation (in %) | Asset B: (VT) Allocation (in %) |
|---|---|---|
| 1 | 100 | 0 |
| 2 | 75 | 25 |
| 3 | 50 | 50 |
| 4 | 25 | 75 |
| 5 | 0 | 100 |
These five portfolios should be seen as examples, as many allocations can be derived from the efficient frontier. To make it easier to recognize the different allocations of a portfolio, we have developed the Transition Map. All allocations can be easily recognized here.
The risk and return numbers of the 5 portfolios:
| Portfolios | Risk | Return |
|---|---|---|
| 1: 100% (VT) | 20.2% | 13.3% |
| 2: 75% (VT), 25% (BND) | 15.6% | 10.3% |
| 3: 50% (VT), 50% (BND) | 11.3% | 7.3% |
| 4: 75% (BND), 25% (VT) | 7.9% | 4.3% |
| 5: 100% (BND) | 6.7% | 1.8% |
In this illustration, for the sake of simplicity and better understanding, we have assumed that the portfolio consists of only two assets A and B. We can similarly construct a portfolio for multiple assets and plot it to reach the frontier.

What is the criticism of the model?
The efficient frontier and modern portfolio theory are based on many assumptions that may not fully reflect reality. One of the assumptions, for example, is that asset returns follow a normal distribution. In reality, the returns of securities (also known as tail risk) can deviate from the mean by more than three standard deviations. This is referred to as a leptokurtic distribution or a distribution with high tail risk.
In addition, Markowitz makes several assumptions in his theory, such as that investors are rational and avoid risk whenever possible, that there are not enough investors to influence market prices, and that investors have unlimited access to credit and loans at the risk-free rate. However, reality proves that the market includes irrational and risk-taking investors, that there are large market participants who could influence market prices, and that there are investors who do not have unlimited access to bonds and loans.
Conclusion
Of course, the Efficient Frontier is not enough to make an investment decision on this basis alone. Nevertheless, it can be a useful data point in the decision-making process. The model is not perfect, but it offers an unemotional way of looking at different risk/return ratios. And so it does have its uses.
If you want to check your own portfolio or a planned investment strategy using the Efficient Frontier, you can easily calculate this for free with our dashboard.