Backtest and analyze your portfolio with
PortfolioMetrics
Backtest your investment strategy to assess performance and risk.
Compare it to a benchmark. Simulate returns. And optimize asset allocation.
Get started for free!
Value Growth
Analyze portfolio value growth and simulate cash flow scenarios.
Performance Analysis
Assess the performance using CAGR, Sharpe ratio, and more.
Risk Analysis
Measure the risk using Volatility, Drawdowns, Value at Risk and more.
Monte Carlo Simulation
Simulate possible portfolio returns using the Monte Carlo method.
Efficient Frontier
Optimize asset allocation using the Markovitz Mean-Variance model.
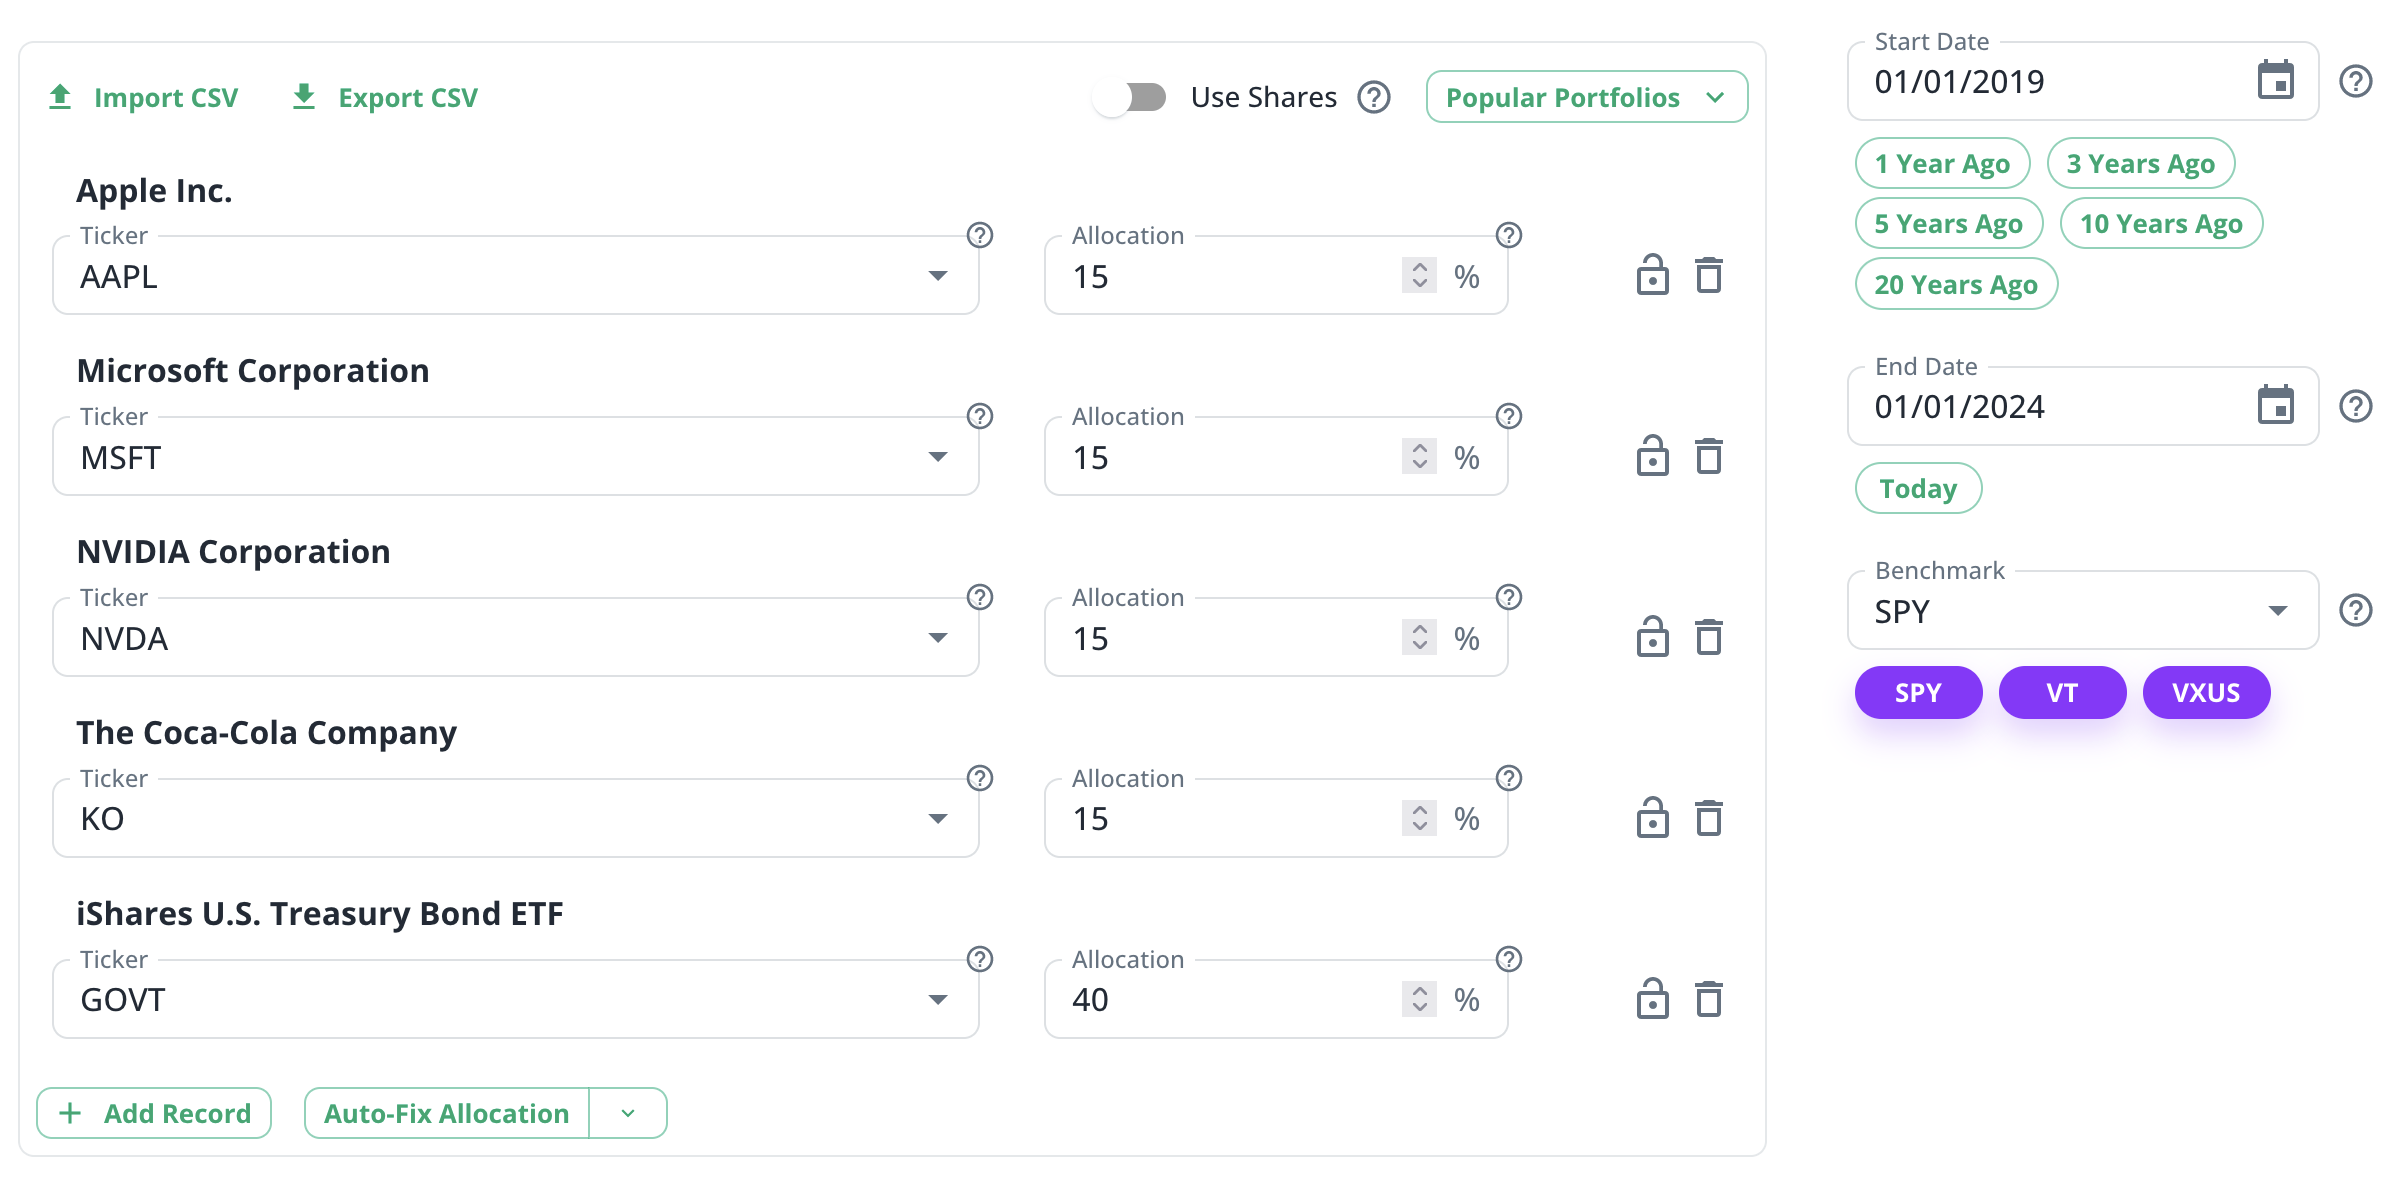
Simply input or upload your portfolio
Input your portfolio within seconds by selecting assets and their allocation. Our platform supports a comprehensive range of assets, including stocks, ETFs, mutual funds, and cryptocurrencies.
Get started with popular "lazy" portfolios. See more.
Find funds that align with your investment goals. See more.
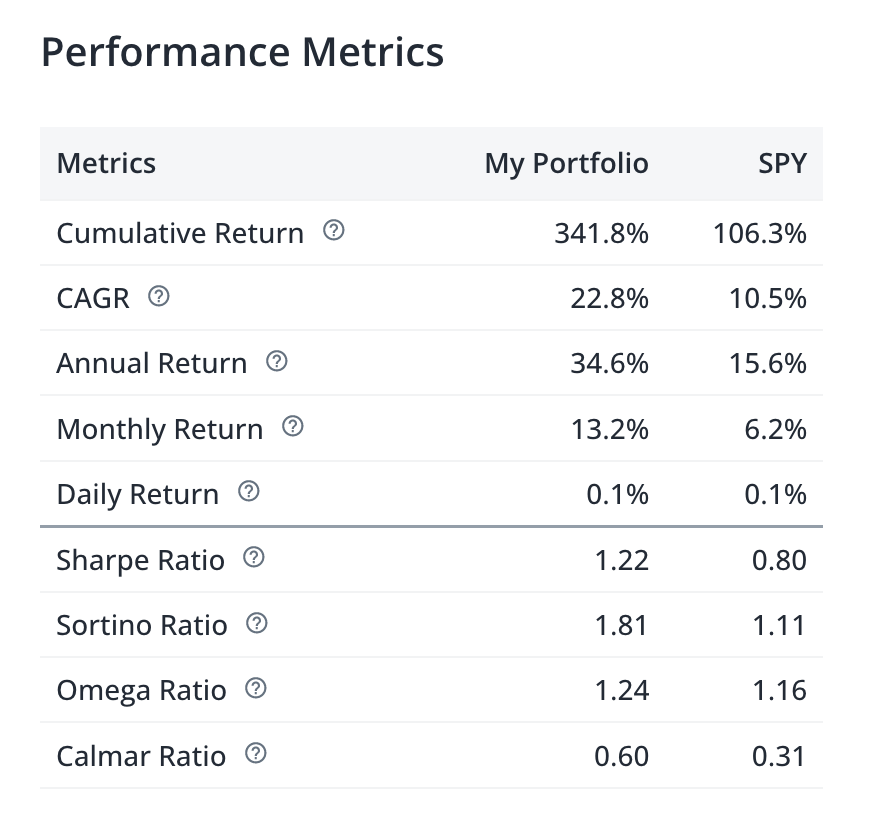
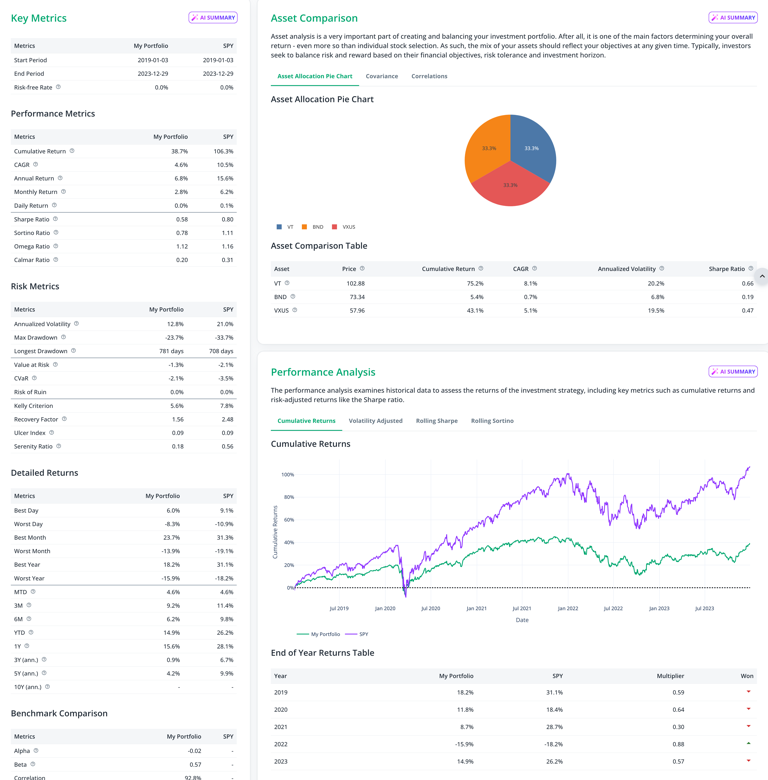
Analyze performance, risks, and growth scenarios
Compare up to three portfolios and a benchmark to evaluate returns and risks, and simulate portfolio value growth with various cash flow strategies like regular contributions and withdrawals.
Analyze performance, risks, and growth scenarios
Compare up to three portfolios and a benchmark to evaluate returns and risks, and simulate portfolio value growth with various cash flow strategies like regular contributions and withdrawals.


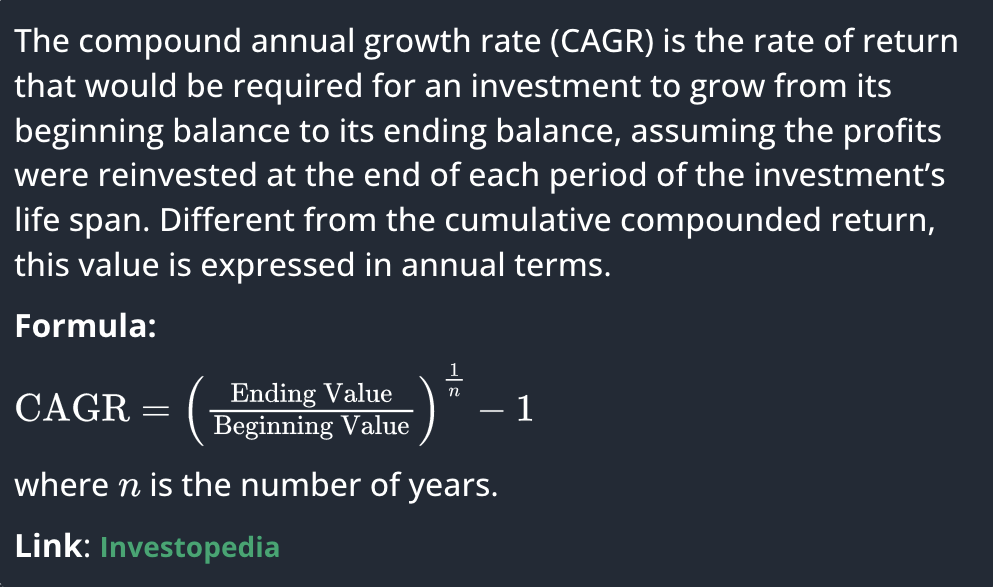
Understand numbers behind your portfolio
Gain a deeper insight into metric definitions and formulas used in our tool. Hover over the "" icon to see the definition.
Find all definitions in a single page. See more.
Understand numbers behind your portfolio
Gain a deeper insight into metric definitions and formulas used in our tool. Hover over the "" icon to see the definition.
Find all definitions in a single page. See more.
Run advanced Monte Carlo and Efficient Frontier computations
Use the Monte Carlo Simulation method to forecast price developments for your investment strategy, including cash flow simulations.
Estimate the Efficient Frontier portfolios and optimize asset allocation for maximum returns within your risk tolerance using the Markowitz Mean-Variance model.


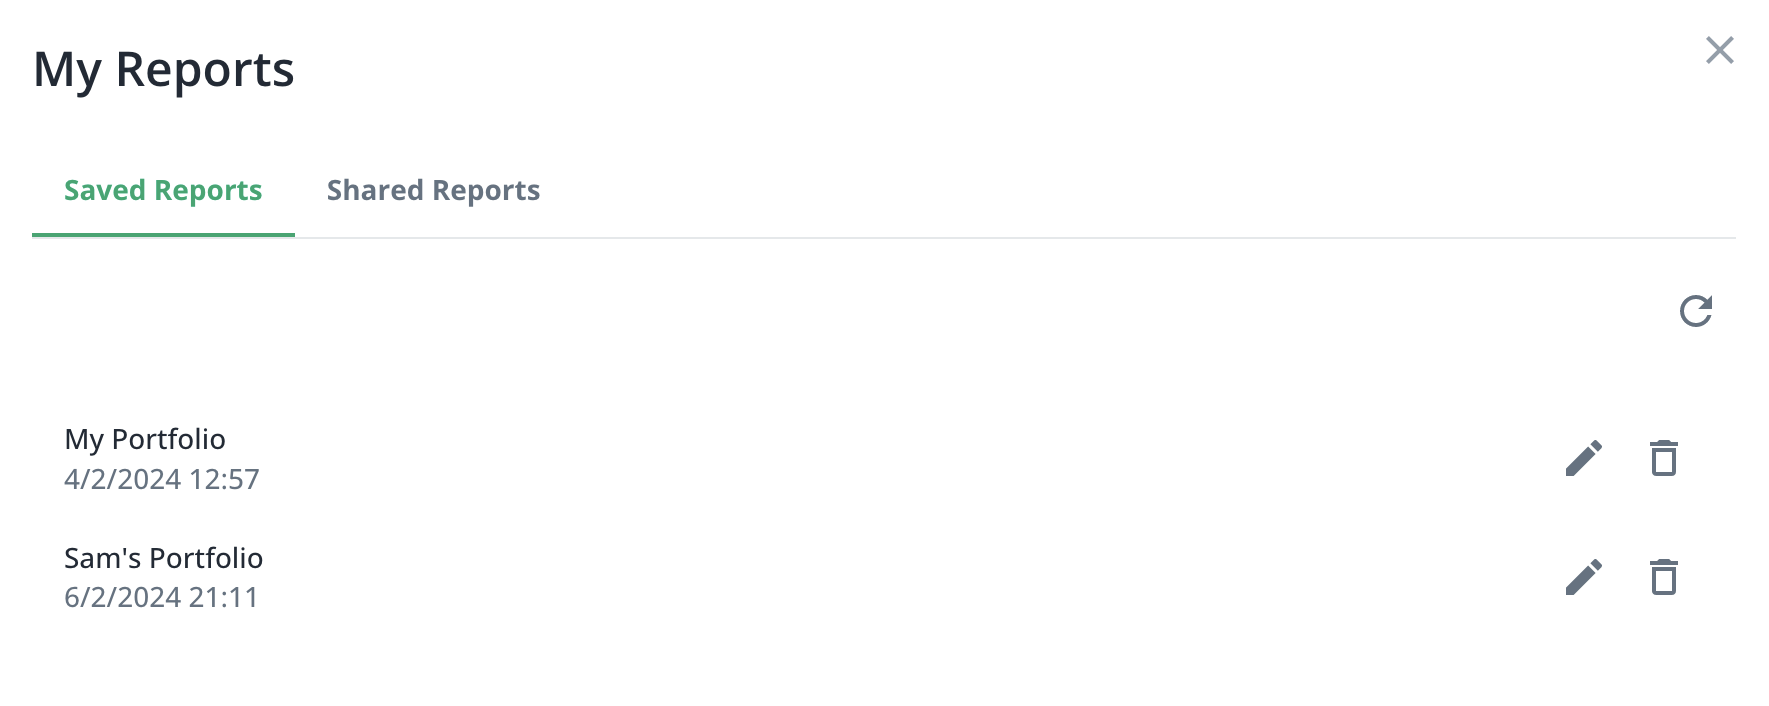
Save and share your backtesting reports
Easily save your portfolio analysis and share it with collaborators or investors. Showcase your strategic approach and outcomes with detailed, shareable reports.
See a shared report as an example.
Save and share your backtesting reports
Easily save your portfolio analysis and share it with collaborators or investors. Showcase your strategic approach and outcomes with detailed, shareable reports.
See a shared report as an example.
Get actionable insights on how to improve
your portfolio through AI ANALYSIS
Look for the button in the report.
See a shared report as an example, or go to the dashboard.
Explain Key Metrics
IMPORTANT: This functionality is developed on GPT-4, a large language model (LLM), powered by OpenAI. LLMs can make mistakes. Consider checking important information.
AI Summary
TLDR
Your portfolio significantly outperformed the SPY benchmark across various performance and risk metrics, showing higher returns and a balanced risk profile.
Key Outcomes
- Superior Returns: Your portfolio's cumulative return stands at 215.0% compared to the benchmark's 105.4%, with a higher CAGR (Compound Annual Growth Rate) of 17.2% versus the benchmark's 10.5%.
- Risk and Reward Balance: Despite slightly higher annualized volatility (22.8% vs. 21.0%), your portfolio maintains a better risk-reward balance, showcased by a Sharpe Ratio of 1.12 against the benchmark's 0.79.
- Recovery and Stability: Your portfolio displays a strong recovery factor of 4.47 and a serenity ratio of 0.81. In contrast, the benchmark shows a lower recovery factor (2.46) and serenity ratio (0.56), indicating your portfolio's superior capacity to recover from drawdowns and maintain stability.
Summary
Your portfolio has not only doubled the cumulative return of the SPY benchmark but also exhibited superior annual and monthly returns. It maintains a better risk-reward balance, showing a higher Sharpe and Sortino ratio, which signifies your strategy's effectiveness in achieving returns per unit of risk taken. Additionally, your risk metrics, such as a lower maximum drawdown and a higher recovery factor, highlight a resilient and effectively managed portfolio that withstands market volatilities better than the benchmark.
These results suggest that your investment strategy has been highly effective over the period analyzed, not only in terms of return generation but also in managing risks effectively. While these outcomes are promising, it's crucial to remember that past performance is not always indicative of future results. Consider maintaining a diversified portfolio and regularly reviewing your investment strategy against your financial goals and risk tolerance.
Please note: This summary should not be considered as financial advice. It's recommended to consult with a qualified financial professional before making any investment decisions.
Elevate Your Investment Strategy
Data-Driven Insights
Reveal comprehensive financial insights with statistical analysis algorithms.
Proven Financial Methods
Leverage established and conventional financial methods.
Rational Decision Making
Take a quantitative investing approach rather than relying on your intuition.
User-Friendly Interface
Experience an intuitive interface designed for ease of use for all users.
Solution for Different Use Cases
Powerful portfolio analysis tools tailored to your specific requirements
For Beginners & Enthusiasts
Start your investment journey with easy-to-use portfolio analysis tools. Learn about different strategies, understand investment risks, and make informed decisions with clear explanations of every metric.
For Professional Investors
Advanced portfolio optimization and risk assessment tools for professional investors. Compare multiple strategies, run sophisticated analyses to make data-driven investment decisions.
For Businesses
Integrate our powerful analysis capabilities into your platform with API access or get custom-tailored reports for your specific needs. Perfect for fintech companies, wealth management firms, and financial advisors.
Ready to get started?
Free
Personal and Non-commercial Use
$0.00 / month
Get started with:
Portfolio Backtesting & Optimization
Save & Share Reports
40+ years of Historical Data
25 Assets per Portfolio
1 Portfolio per Report
10 Saved Reports
5 AI Summaries per month
1-year Monte Carlo Forecasts
Limited Support
Premium
Personal and Non-commercial Use
$13.90 / month
Everything in Free, plus:
Advanced Risk-Return Estimation
Custom Risk-Return Assumptions
200 Assets per Portfolio
1-5 Portfolios per Report
100 Saved Reports
Unlimited AI Summaries
50-year Monte Carlo Forecasts
Standard Support
Professional
Commercial Use
$46.90 / month
Everything in Premium, plus:
PDF Reports
CSV Data Export
Custom Market Data Portfolios
Unlimited Assets per Portfolio
Unlimited Saved Reports
Priority Support
Enterprise
Commercial Use
Do you need more features or API access?
Customize a plan that fits your unique business needs
Contact us at sales@portfoliometrics.net
Everything in Professional, plus:
API Access
Customized Reports & Endpoints
Priority Support
Frequently Asked Questions
Backtesting is the process of testing a trading or investment strategy using historical data to evaluate its performance. It helps users assess the viability and potential risks of their strategies before applying them in real-time.
Moreover, backtesting can help you find out what investment strategies work well in which market conditions. For example, you might find out that your strategy only works in a bull market while it is unsuitable for a bear market. Backtesting is also an important step in becoming more rational and data-driven in your investment decisions. This means avoiding strategies that are overly-optimistic or 'too good to be true'.
Portfolio backtesting provides several benefits, including the ability to evaluate the historical performance of your investment strategy, identify potential strengths and weaknesses, and make informed decisions about future investment choices. It allows users to assess risk, optimize asset allocation, and gain insights into how their portfolio would have fared under different market conditions.
PortfolioMetrics is a comprehensive web application designed for investors to assess the performance and risk of their investment strategies. It allows users to backtest portfolios, compare them to benchmark indices, simulate returns, and optimize asset allocation. The platform provides valuable insights to help users make informed decisions and enhance their investment strategies.
Yes, the main functionality of the PortfolioMetrics is available for free. Users can access core features, including investment strategy backtesting, portfolio analysis and visualization without any cost. See the pricing page with the list of free and premium features.
PortfolioMetrics allows users to input their investment portfolios, and then tests these against historical market data. The application simulates how the strategy would have performed in the past, providing insights into potential returns and risks.
The dashboard provides a comprehensive set of financial metrics and charts, including but not limited to portfolio returns, drawdowns, Sharpe ratio, and more. Visual representations help users better understand the strategy's performance over time.
Yes, the PortfolioMetrics is designed to cater to users with varying levels of experience. Whether you are a seasoned investor or a beginner, the user-friendly interface makes it easy to navigate and utilize the platform effectively.
However, it is important to emphasise that while the tool is accessible to anyone, beginners who want to understand the intricacies of financial methods should explore these methods further beyond our tool and learn more e.g. via Investopedia.
Yes, the PortfolioMetrics is actively in development. We are committed to enhancing the user experience and plan to roll out additional features in future updates. Stay tuned for exciting developments that will further empower you in analyzing and optimizing your investment strategies.