
Markets change, and so does your portfolio. We know how important it is to stay in control of your investments. Without adjustments, you might end up with more risk or less diversification than you intended. That's where portfolio optimization comes in—it helps you make informed decisions, whether you're rebalancing efficiently or targeting a specific risk-return profile.
We've seen firsthand how useful optimization can be, and we want to share two practical ways you can use it in your own investing strategy. Plus, if you'd rather watch than read, check out our video walkthrough:
Use Case 1: Rebalancing with Constraints
You want to rebalance your portfolio, but you have certain constraints in mind. Maybe you want to limit exposure to individual stocks or sectors while still optimizing for returns. You want to achieve a balanced allocation that aligns with your strategy, an optimizer helps you stay within your targets while keeping your allocation aligned.
Let's say you want to optimize the following portfolio:
Initial Portfolio
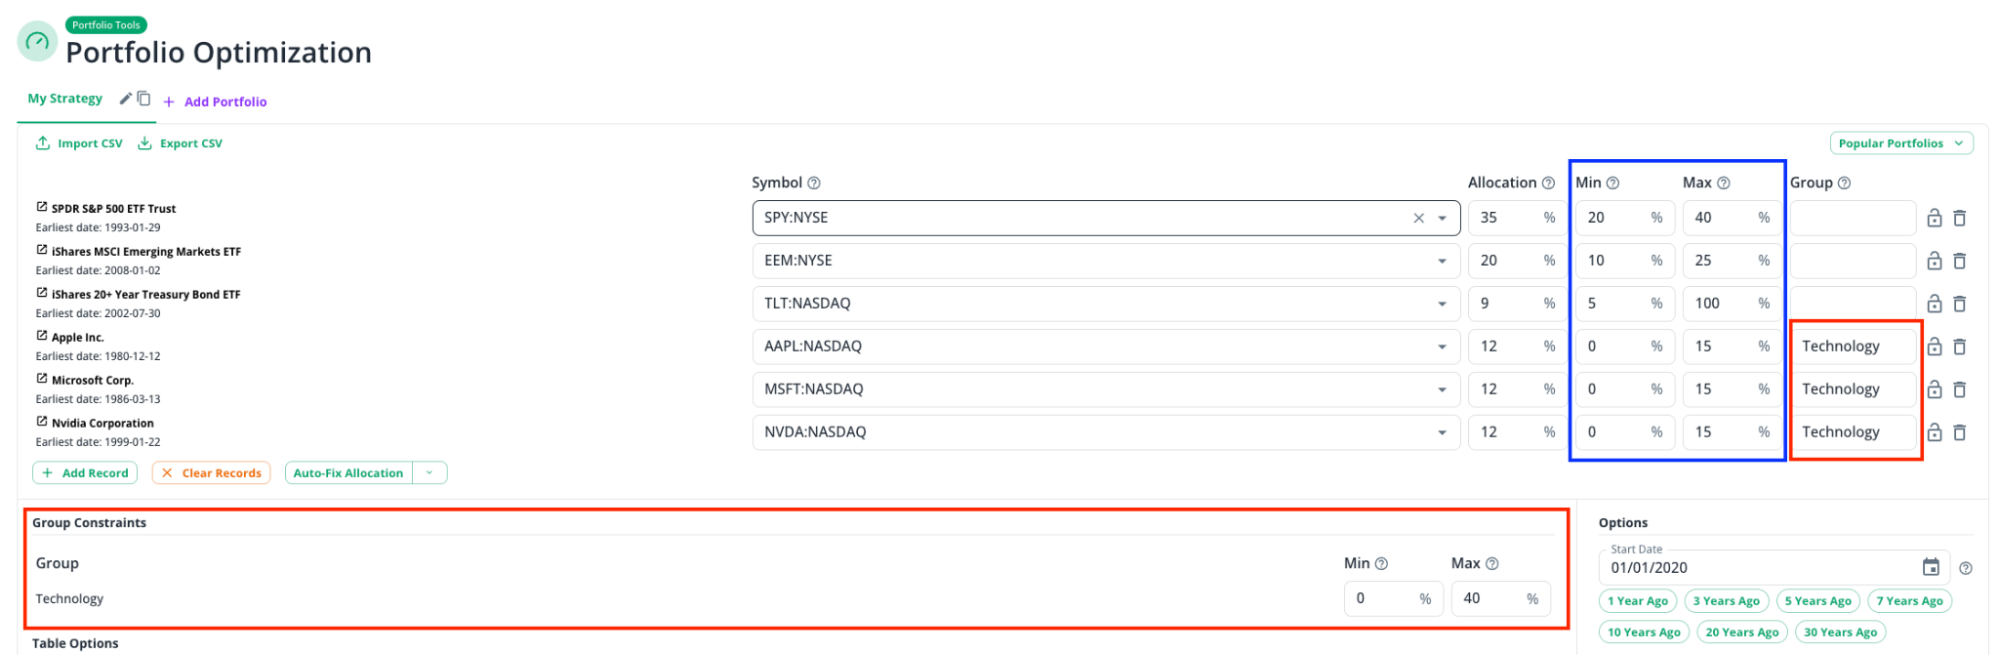
35% S&P 500 ETF (SPY), 20% Emerging Markets ETF (EEM), and 9% U.S. Treasury Bonds (TLT), 12% Apple (AAPL), 12% Microsoft (MSFT) and 12% Nvidea (NVDA)
And you want to have specific constraints:
- No single stock should exceed 15% of the portfolio. (→ Blue Frame)
- A minimum of 5% should be allocated to bonds for balancing risk. (→ Blue Frame)
- Emerging markets allocation should stay between 10%-25% to ensure diversification without overexposure. (→ Blue Frame)
- Technology sector exposure should be capped at 40%. (→ Red Frame)
Let's see how rebalancing within constraints improves efficiency by running the initial portfolio through different optimization strategies.
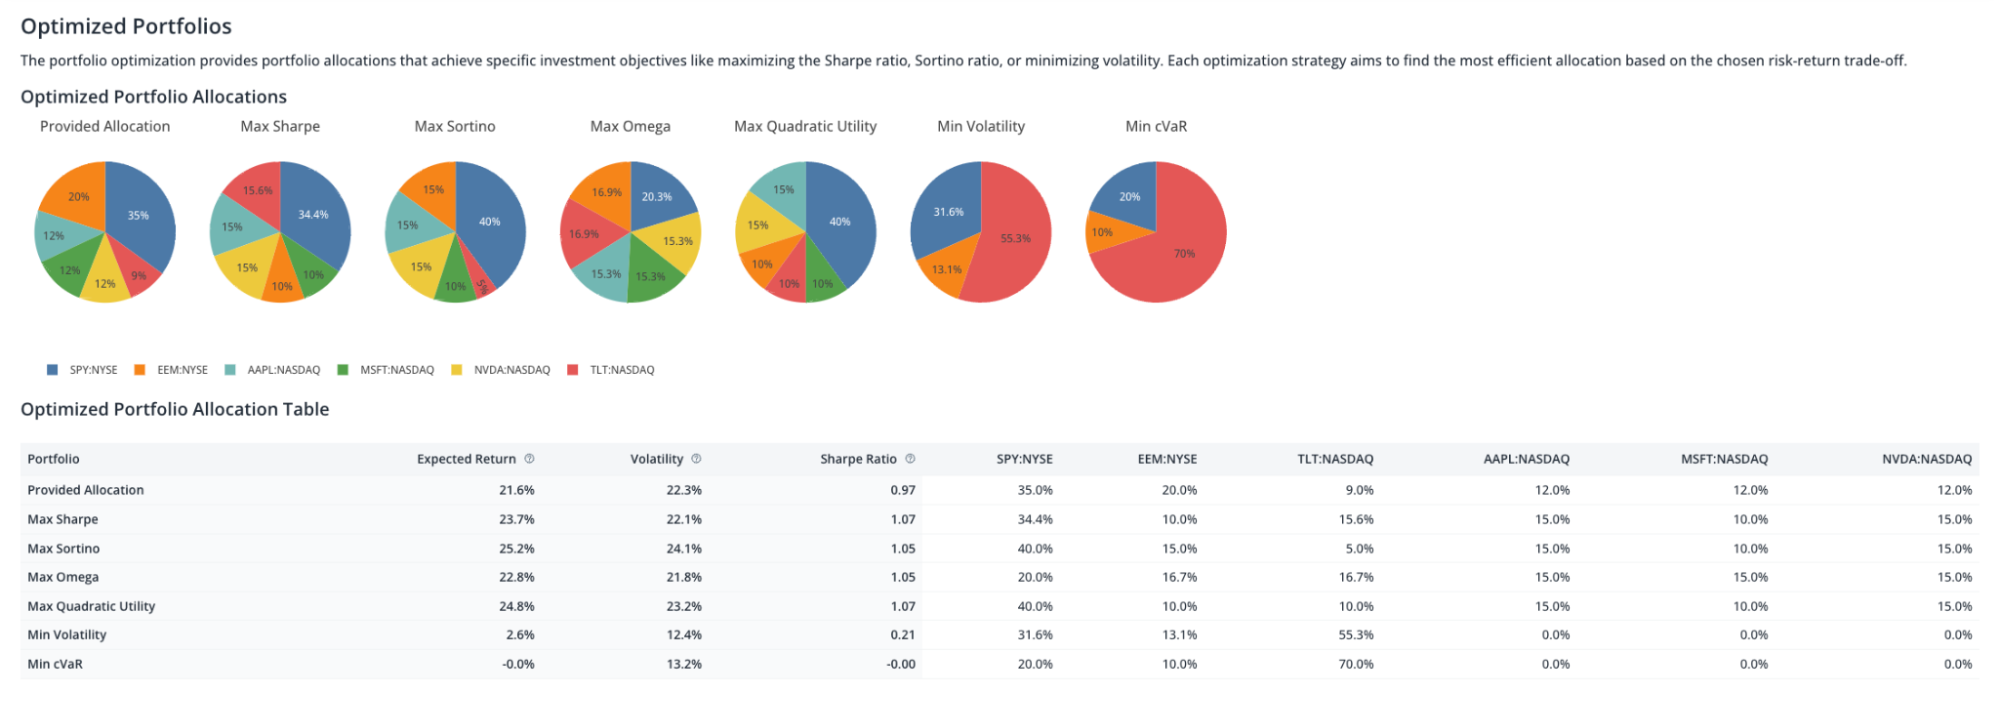
- If we optimize for Max Sharpe,
we get a higher return (23.7%) while slightly reducing risk (22.1%) compared to the baseline allocation (21.6% return, 22.3% volatility). Since the Sharpe ratio measures risk-adjusted return, this means we are maximizing the efficiency of each unit of risk taken—ideal for investors who want the best balance between risk and reward.
- Alternatively, if we optimize for Min Volatility,
we significantly lower risk to 12.4%, though this comes at the cost of a much lower expected return (2.6%). This is useful for investors prioritizing stability and capital preservation over high returns.
- Another approach is optimizing for Max Sortino,
which results in a 25.2% return with 24.1% volatility. Since the Sortino ratio focuses on downside risk rather than total volatility, this is beneficial for investors who want to avoid large losses rather than all fluctuations in returns.
Why This Matters
Without these constraints, tech stocks could have dominated the portfolio, increasing volatility, or individual stocks like Apple, Microsoft, or Nvidia might have exceeded 15%, leading to overexposure. By capping tech at 40% and ensuring a minimum bond allocation, the optimizer maintained diversification and risk control while still improving efficiency. The results show how constraints help shape a balanced portfolio that aligns with both return and risk goals.
Use Case 2: Defining Expected Returns and Volatility
When constructing a portfolio, you might have specific assumptions for returns and risk. Instead of relying only on historical performance, you may want to define your own expected return and volatility based on fundamental analysis, market outlook, or other forecasting methods. An optimizer helps you align your portfolio with these expectations while balancing risk.
Let's say you want to optimize the following portfolio:
Initial Portfolio & Custom Risk-Return Assumptions
| Asset | Allocation | Expected Return | Expected Volatility |
|---|---|---|---|
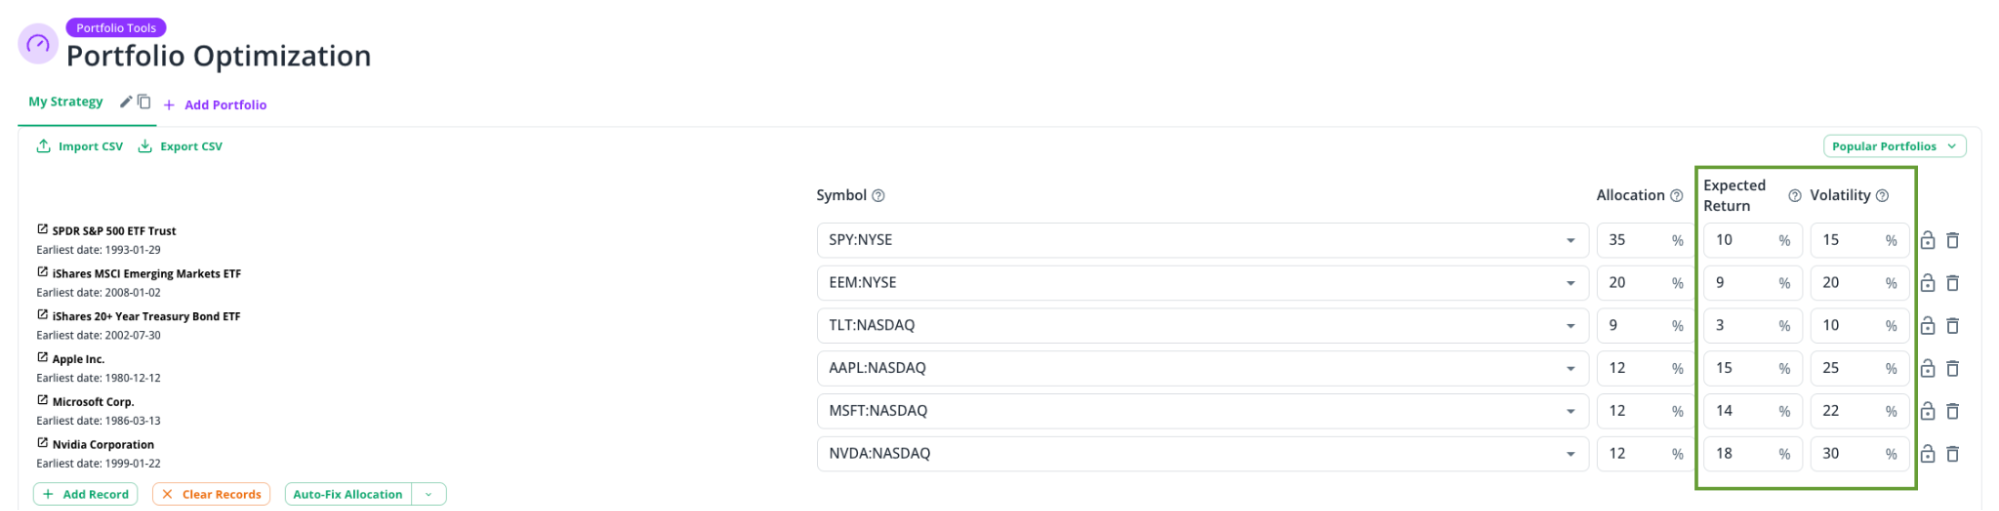
| S&P 500 ETF (SPY) | 35% | 10% | 15% |
| Emerging Markets ETF (EEM) | 20% | 9% | 20% |
| U.S. Treasury Bonds (TLT) | 9% | 3% | 10% |
| Apple (AAPL) | 12% | 15% | 25% |
| Microsoft (MSFT) | 12% | 14% | 22% |
| NVIDIA (NVDA) | 12% | 18% | 30% |
Note: Users are not required to fill in all Expected Return and Volatility fields; they can be left empty. Our tool automatically detects empty fields and estimates the Expected Return and Volatility using historical data based on the selected Risk-Return Estimation method.
Let's run the calculations and see how portfolio optimization adjusts allocations based on different risk-return profiles along the efficient frontier.
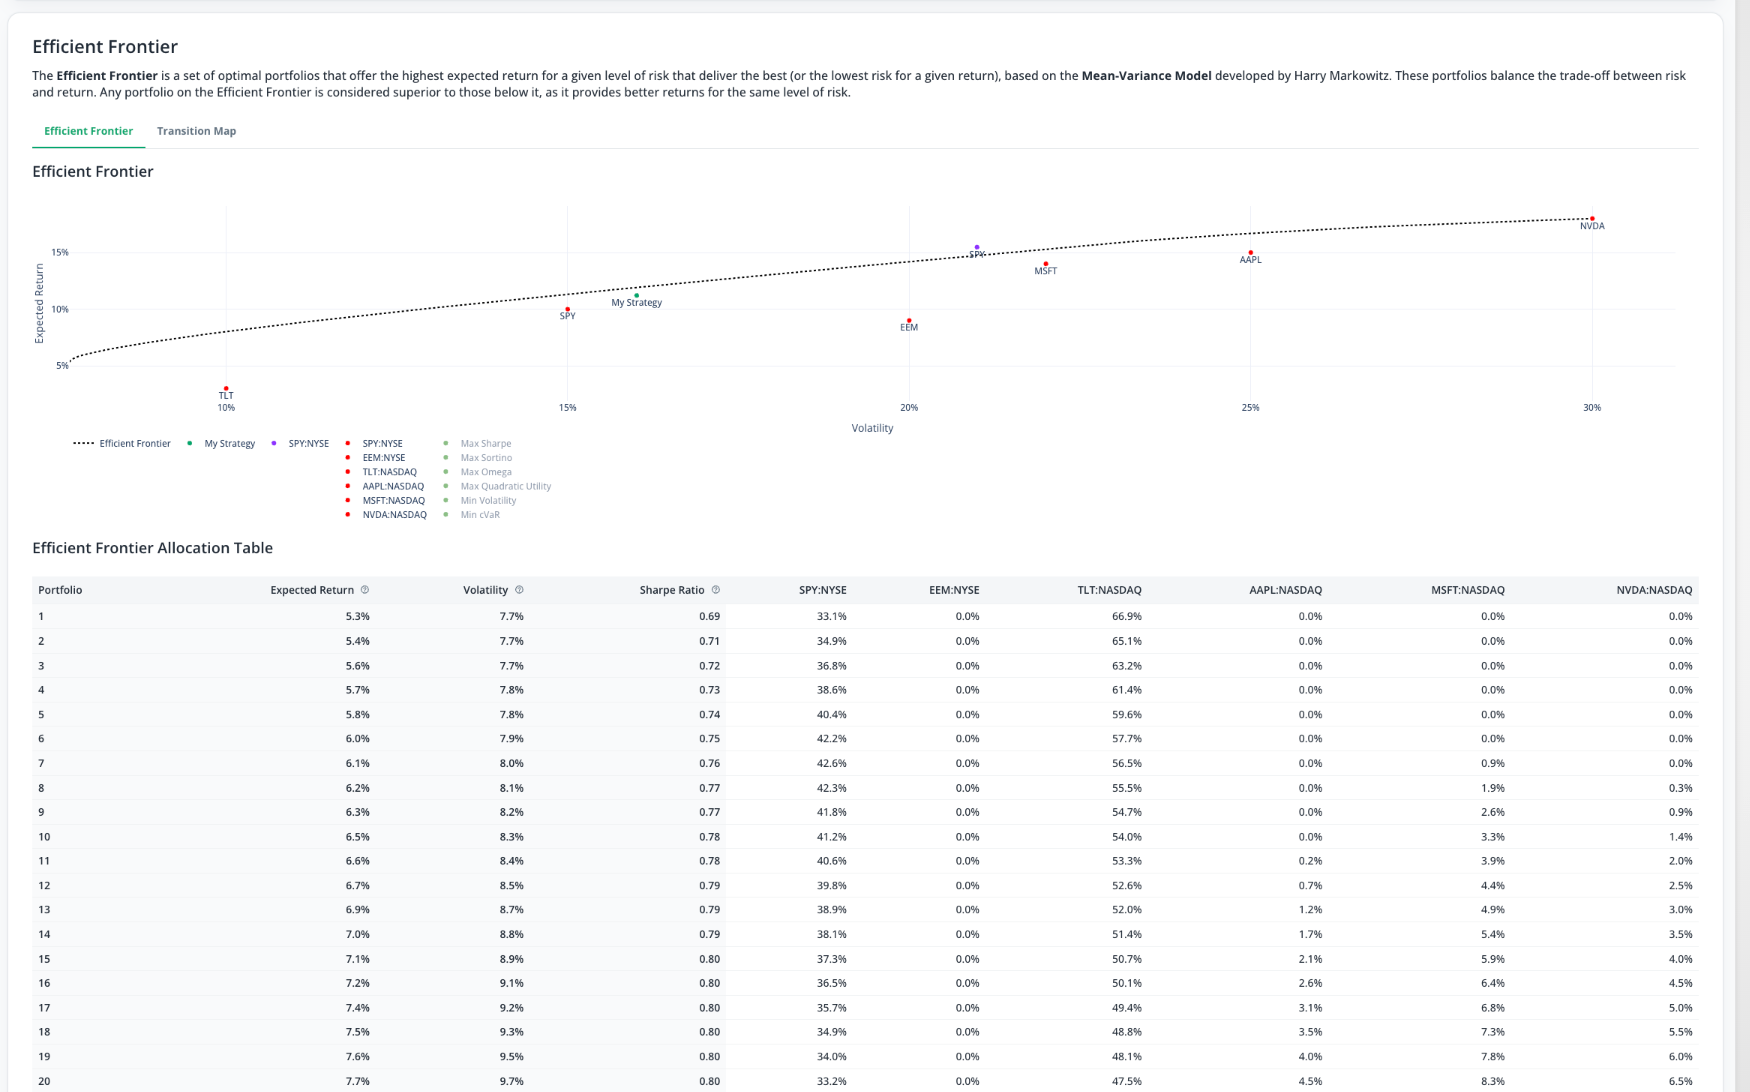
The efficient frontier represents the best possible portfolios for a given level of risk, helping us find the most efficient allocation that meets our return and volatility goals. By running our initial portfolio through this optimization, we see how the balance between return and risk shifts.
How the Efficient Frontier Adjusts the Portfolio
- Portfolio 1 (Low Risk, Low Return) → 5.3% return, 7.7% volatility
Positioned at the low-risk end of the efficient frontier, this portfolio prioritizes stability. The optimizer assigns a heavy 66.9% weight to bonds (TLT), significantly reducing volatility but also limiting growth. This allocation is ideal for risk-averse investors focused on capital preservation. - Portfolio 50 (Balanced, Higher Risk) → 11.6% return, 15.5% volatility
As we move further along the efficient frontier, the optimizer increases exposure to higher-growth assets. This portfolio shifts toward tech-heavy allocations, with 18.5% in Apple, 22.9% in Microsoft, and 21.6% in Nvidia. While this improves risk-adjusted returns (Sharpe Ratio: 0.75), it introduces a higher level of concentration risk. - Portfolio 100 (Max Return, Max Risk) → 18.0% return, 30.0% volatility
At the extreme high-risk end, the optimizer selects 99.7% Nvidia, fully maximizing expected return but at the cost of diversification. This highly speculative allocation offers the highest potential return but also carries the most volatility—suitable only for investors with an exceptionally high risk tolerance.
Why This Matters
Rather than relying on static allocations, the optimizer adjusts the portfolio dynamically to find the most efficient balance between return and risk. Across different portfolios along the efficient frontier, we see a range of outcomes:
- A low-risk portfolio with 5.3% return and 7.7% volatility, heavily weighted in bonds.
- A balanced portfolio with 11.6% return and 15.5% volatility, distributing exposure across stocks and bonds while maintaining diversification.
- A high-risk, high-return portfolio with 18.0% return and 30.0% volatility, nearly fully concentrated in Nvidia.
By defining constraints and desired risk-return characteristics, the optimizer constructs data-driven allocations that adapt to different risk preferences—instead of relying on static, historical allocations.


