We’ve added an update to our dashboard - 48 different combinations for Monte Carlo simulations are now available for users.
Why? Because the results of a Monte Carlo simulation can vary a lot depending on the estimated model parameters – expected returns and covariance of the assets. To make sure you have the tools to handle different scenarios, we’re giving you more flexibility to choose the estimation method that fits your needs.
In this article, we’ll show you how these methods differ and share some concrete use cases to help you make the most of them. Plus, here is a video walkthrough if you’d rather watch than read!
The Impact of Calculation Methods: Starting Portfolio
Let’s say you’re running a Monte Carlo simulation for a portfolio starting with $10,000. You’ve got a mix of 40% iShares U.S. Treasury Bond ETF, 15% Apple, 15% Microsoft, 15% NVIDIA, and 15% Coca-Cola. Sounds solid, right?
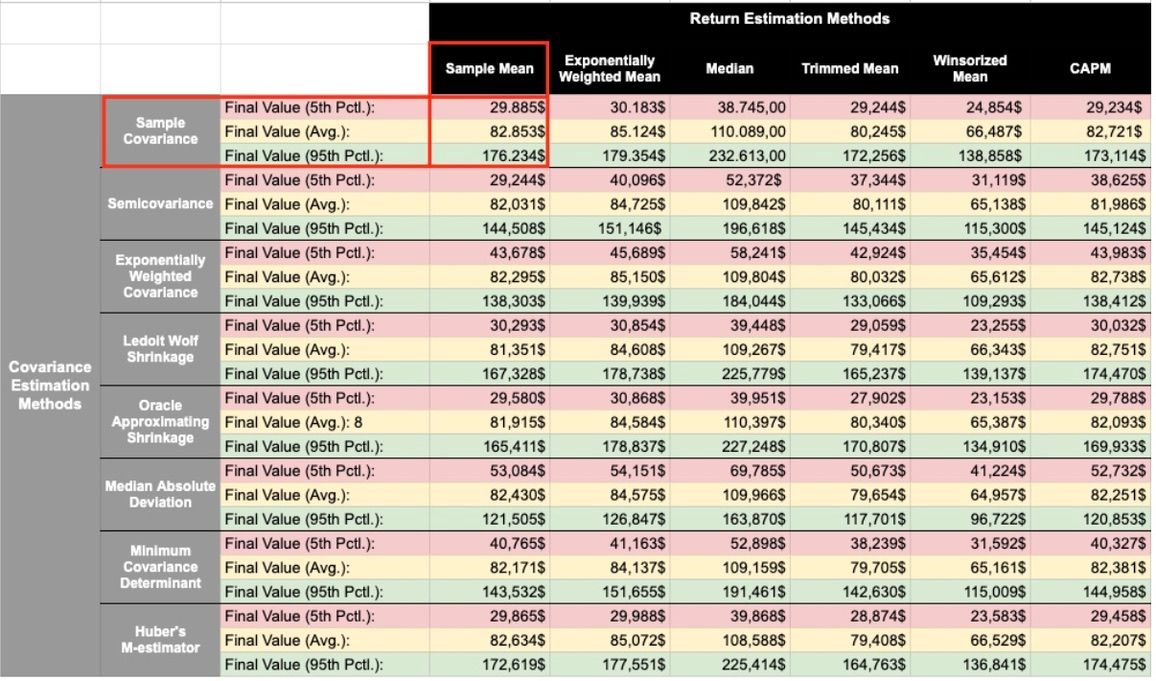
Now, imagine simulating this portfolio 10 years into the future using historical data from 01/01/2020 to 01/01/2025. The results you get depend entirely on the parameter estimation method you choose-and they can vary a lot. For example, using Sample Mean and Sample Covariance, the simulation shows a worst-case scenario of around $29,885 and a best case of $176,234. Switch to a different method, and those numbers shift strongly. It’s the same portfolio, but the approach has a big impact on the outcome.

This isn’t just a technical detail-it’s about understanding your risk, your potential, and how the choices you make impact the financial forecast. Let’s dive deeper and look at two practical cases to show how you can use this flexibility to your advantage. We don’t want to drag you through too much theory right now-but if you’re curious, we’ve included a quick summary of all 48 methods at the end.
Case 1: Putting More Weight on Recent Events – Exponentially Weighted
Let’s say you’re looking at market trends, and you want to downplay the impact of outlier events like COVID-19. Maybe you believe the market has moved on, and you’re more interested in what’s been happening recently. In this case, you’d want methods that prioritize recent data while reducing the influence of older, less relevant periods.
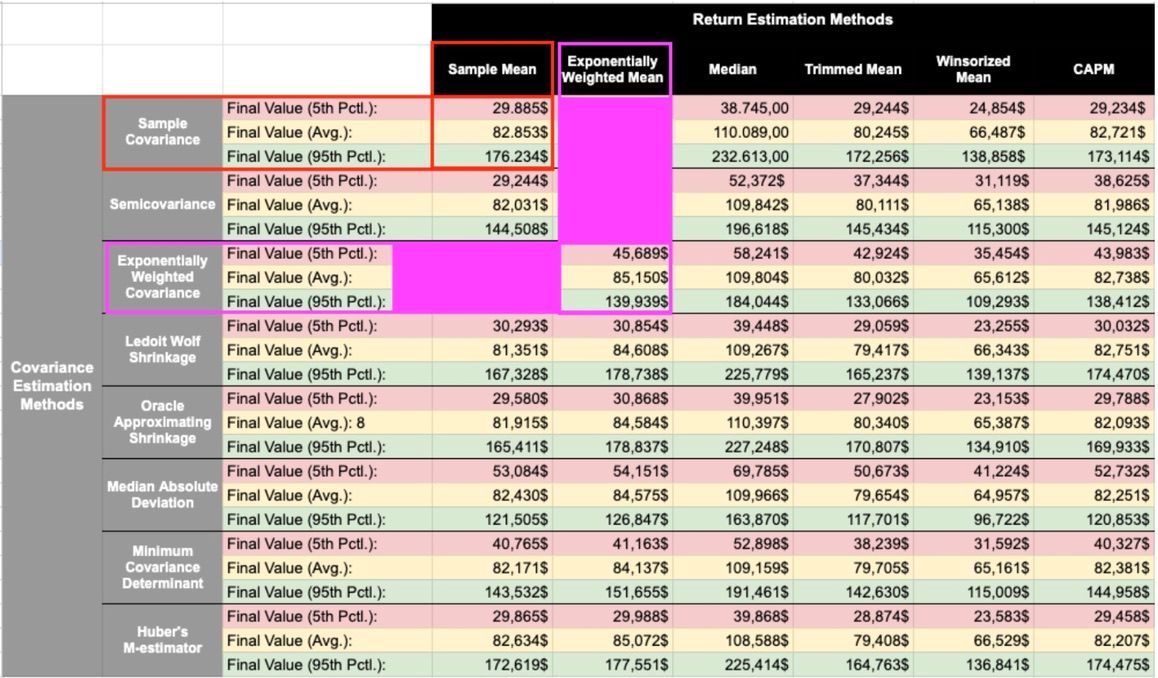
A great combination for this is Exponentially Weighted Mean for returns and Exponentially Weighted Covariance for relationships between assets. Here’s how it performs:
- 5th Percentile (worst case): $45,689 compared to $29,885 with the Sample approach.
- Average outcome: $85,150 versus $82,853 for the Sample method.
- 95th Percentile (best case): $139,939, which is lower than the Sample’s $176,234.

While the best-case value is slightly lower, this method leads to an outcome that aligns more closely with recent market dynamics and the belief that the future is best predicted by the most current events.
Case 2: If You Suspect Data for Particular Assets Might Be Flawed – Median
Sometimes, you might not completely trust the data for certain assets. Perhaps there’s a chance it includes anomalies-like a sudden price spike or an extreme return that doesn’t align with the broader market. In these situations, you need methods that reduce the influence of such outliers and focus on more reliable trends.
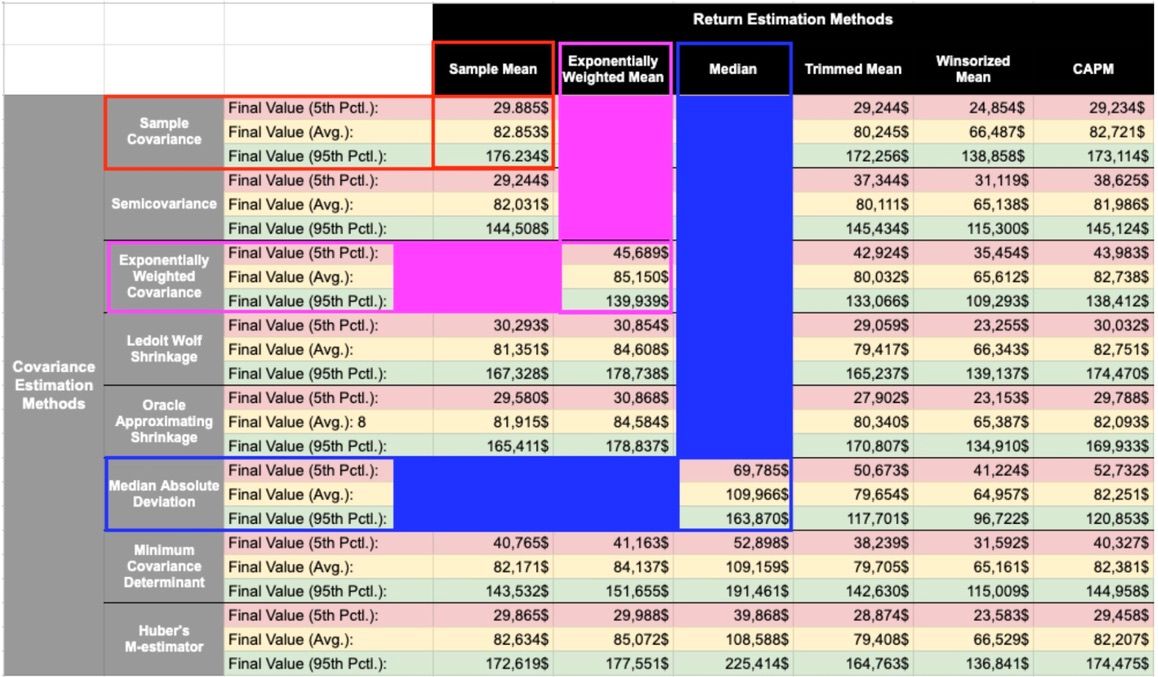
A strong choice for this scenario is Median for returns and Median Absolute Deviation for covariance. Here’s how it performs:
- 5th Percentile (worst case): $69,785 compared to $29,885 with the Sample approach.
- Average outcome: $109,966 versus $82,853 for the Sample method.
- 95th Percentile (best case): $163,870 compared to $176,234 for the Sample approach.
While we focus on Median here for simplicity, methods like Trimmed Mean or Winsorized Mean - which remove around 20% of data points instead of retaining only two - can also be effective.

This combination works by minimizing the impact of extreme values. For instance, if one asset experiences an unusually high or low return, the Median method focuses on the central data points, ensuring that such extremes don’t distort the results. The same logic applies to covariance, where anomalies in correlations are downplayed.
By filtering out unreliable inputs, this approach provides a much stronger worst-case scenario and a higher average, ensuring your results remain robust and trustworthy. If you’re unsure about the quality of your data, this is the method to rely on.
All Return Estimation Methods we’ve integrated
The method used to estimate expected returns for assets in the portfolio. Available options:
- Sample Mean: Traditional arithmetic mean of historical returns. Simple but sensitive to outliers.
- Exponentially Weighted Mean: Weighted average that gives more importance to recent observations. Useful when recent data is considered more relevant.
- Median: Middle value of returns when sorted. More robust to outliers than mean.
- Trimmed Mean: Mean calculated after removing extreme values (both high and low). Reduces impact of outliers.
- Winsorized Mean: Similar to trimmed mean, but instead of removing extremes, replaces them with nearest non-extreme values.
- CAPM: Capital Asset Pricing Model estimates returns based on asset's relationship with market returns and risk-free rate. Uses beta coefficient and market risk premium.
All Covariance Estimation Methods we’ve integrated
The method used to estimate the covariance matrix for risk calculations. Available options:
- Sample Covariance: Traditional method calculating how assets move together. Simple but sensitive to outliers.
- Semicovariance: Measures covariance considering only negative returns, focusing on downside risk.
- Exponentially Weighted Covariance: Gives more weight to recent observations in covariance calculation.
- Lefoit Wolf Shrinkage: Reduces estimation error by combining sample covariance with structured estimator.
- Oracle Approximating Shrinkage: Advanced shrinkage method that adapts to the data structure.
- Median Absolute Deviation: Robust estimation method less sensitive to outliers than standard deviation.
- Minimum Covariance Determinant: Robust method that identifies and excludes outliers before computing covariance.
- Huber's M-estimator: Robust estimation technique that reduces influence of outliers while maintaining efficiency.
Help Us Improve
We’re always looking to enhance our tools and make them more useful for you. If you have any suggestions for features or methods we should develop next, we’d love it if you would write that into our survey.
Thanks a lot!