Some of our users have asked a simple but important question: "When I look at a backtest, how do I actually use the numbers I see?"
It's a great question. Even the best charts and simulations mean little unless you know what to look for. That's why we're breaking down three of the most fundamental metrics you'll find in every backtest report: CAGR, Volatility, and Maximum Drawdown.
Each of them tells a different part of the story. Return shows how much your portfolio grew on average. Volatility shows how bumpy the ride was. Max drawdown shows the worst loss you would have faced along the way.
Let's explore these metrics using three strategies and SPY as benchmark:
-
Three-Fund Portfolio: VTI, VXUS, BND (33.3% each)
-
Warren Buffett's 90/10 Portfolio: VOO 90%, VGSH 10%
-
FAANG Portfolio: META, AMZN, AAPL, NFLX, GOOGL (20% each)
-
Benchmark: SPY
The portfolios were tested over 10 years (2015-07-01 to 2025-07-01) with a starting value of $10,000 and annual rebalancing.
1. Compound Annual Growth Rate (CAGR): How much did the portfolio grow each year?
The Compound Annual Growth Rate (CAGR) shows the average yearly growth over the entire period. It smooths out the ups and downs to show the steady pace your portfolio would have needed to reach its final value.
It's one of the most common ways to compare long-term portfolio performance. But it doesn't tell you whether the road was smooth or rocky.
Results of the backtest:
-
The FAANG portfolio delivered the strongest growth at 26.7% CAGR, driven by tech stock momentum.
-
Buffett's 90/10 strategy returned 12.8%, close to the 13.5% of the S&P 500.
-
The Three-Fund Portfolio was more conservative, with a 7.8% CAGR, prioritizing diversification over maximum growth.

2. Volatility: How much did the portfolio fluctuate?
Volatility is the standard deviation of returns. It shows how much your portfolio's value moved up and down over time. In simpler terms, it shows how much your portfolio's value jumped up and down along the way.
If two portfolios have the same return but one has double the volatility, your experience as an investor would have felt very different. One smooth and steady, the other wild and unpredictable.
Results of the backtest:
-
FAANG had the highest volatility at 27.5%, meaning sharp swings in value.
-
The Three-Fund Portfolio was much calmer at 12.8%, making it easier to hold through rough patches.
-
Buffett's 90/10 and SPY were in the middle, at 17.1% and 18.3%, balancing growth and risk.

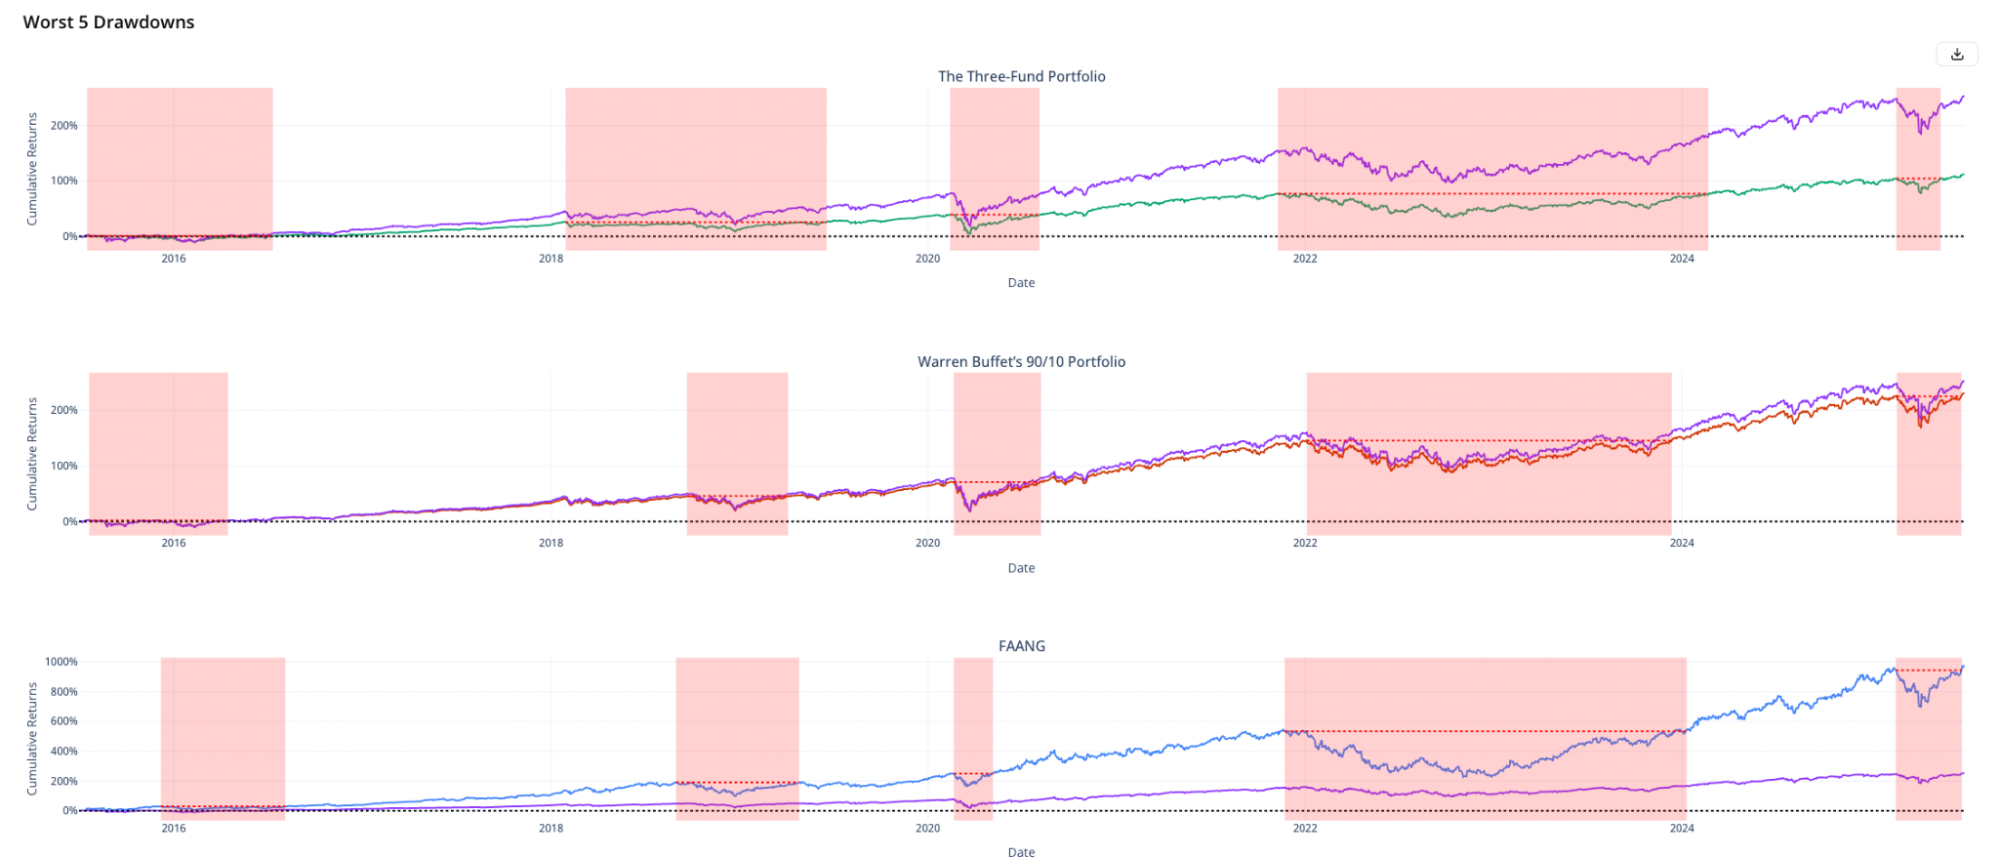
3. Maximum Drawdown: How deep was the worst loss?
Max Drawdown shows the biggest decline from a portfolio's peak to its lowest point before recovering. It answers the question, "How much would I have lost if I had invested at the worst possible time?"
This metric is crucial for your emotional and financial comfort. Large drawdowns can push investors to sell at the worst time, turning temporary losses into permanent ones.
Results of the backtest:
- The FAANG portfolio suffered a steep -49.5% max drawdown. Growth came with big crashes.
- Buffett's 90/10 and SPY both saw significant losses of -31.8% and -33.7%.
- The Three-Fund Portfolio held up better during downturns, with a drawdown of -25.0%.

Putting the Metrics in Context
These three portfolios show how very different return and risk profiles can be:
| Portfolio | CAGR | Volatility | Max Drawdown |
|---|---|---|---|
| Three-Fund Portfolio (VTI/VXUS/BND) | 7.8% | 12.8% | -25.0% |
| Buffett's 90/10 (VOO/VGSH) | 12.8% | 17.1% | -31.8% |
| FAANG (META, AMZN, AAPL, NFLX, GOOGL) | 26.7% | 27.5% | -49.5% |
| S&P 500 Benchmark (SPY) | 13.5% | 18.3% | -33.7% |
No single metric wins. A higher CAGR looks great, but if the drawdown is so steep you would have bailed out during a crash, it's not the right fit. Similarly, low volatility might mean smoother returns but slower growth. It's all about fit.
- FAANG: Big growth, big risk.
- Buffett's 90/10: Simple, strong, but still exposed to market crashes.
- Three-Fund: Diversified and steady, but won't shoot the lights out.
Conclusion: Putting Performance in Perspective
These numbers don't predict the future, but they help you understand the past—and yourself. By knowing how much risk and reward a strategy has historically delivered, you can make clearer decisions about what fits your financial goals and emotional comfort.
If you're backtesting your own portfolio, take the time to review these metrics. They show not only how your investments might have grown, but also how they reacted when markets turned difficult. This perspective helps you choose strategies you can stay committed to, even when volatility returns.