Since we launched PortfolioMetrics last October, we’ve been dedicated to continually improving the application and user experience. As we reach the midpoint of 2024, we’re excited to share the latest updates and features that make investment analysis more insightful and fun to use.
Portfolio Growth Analysis with Cash Flows
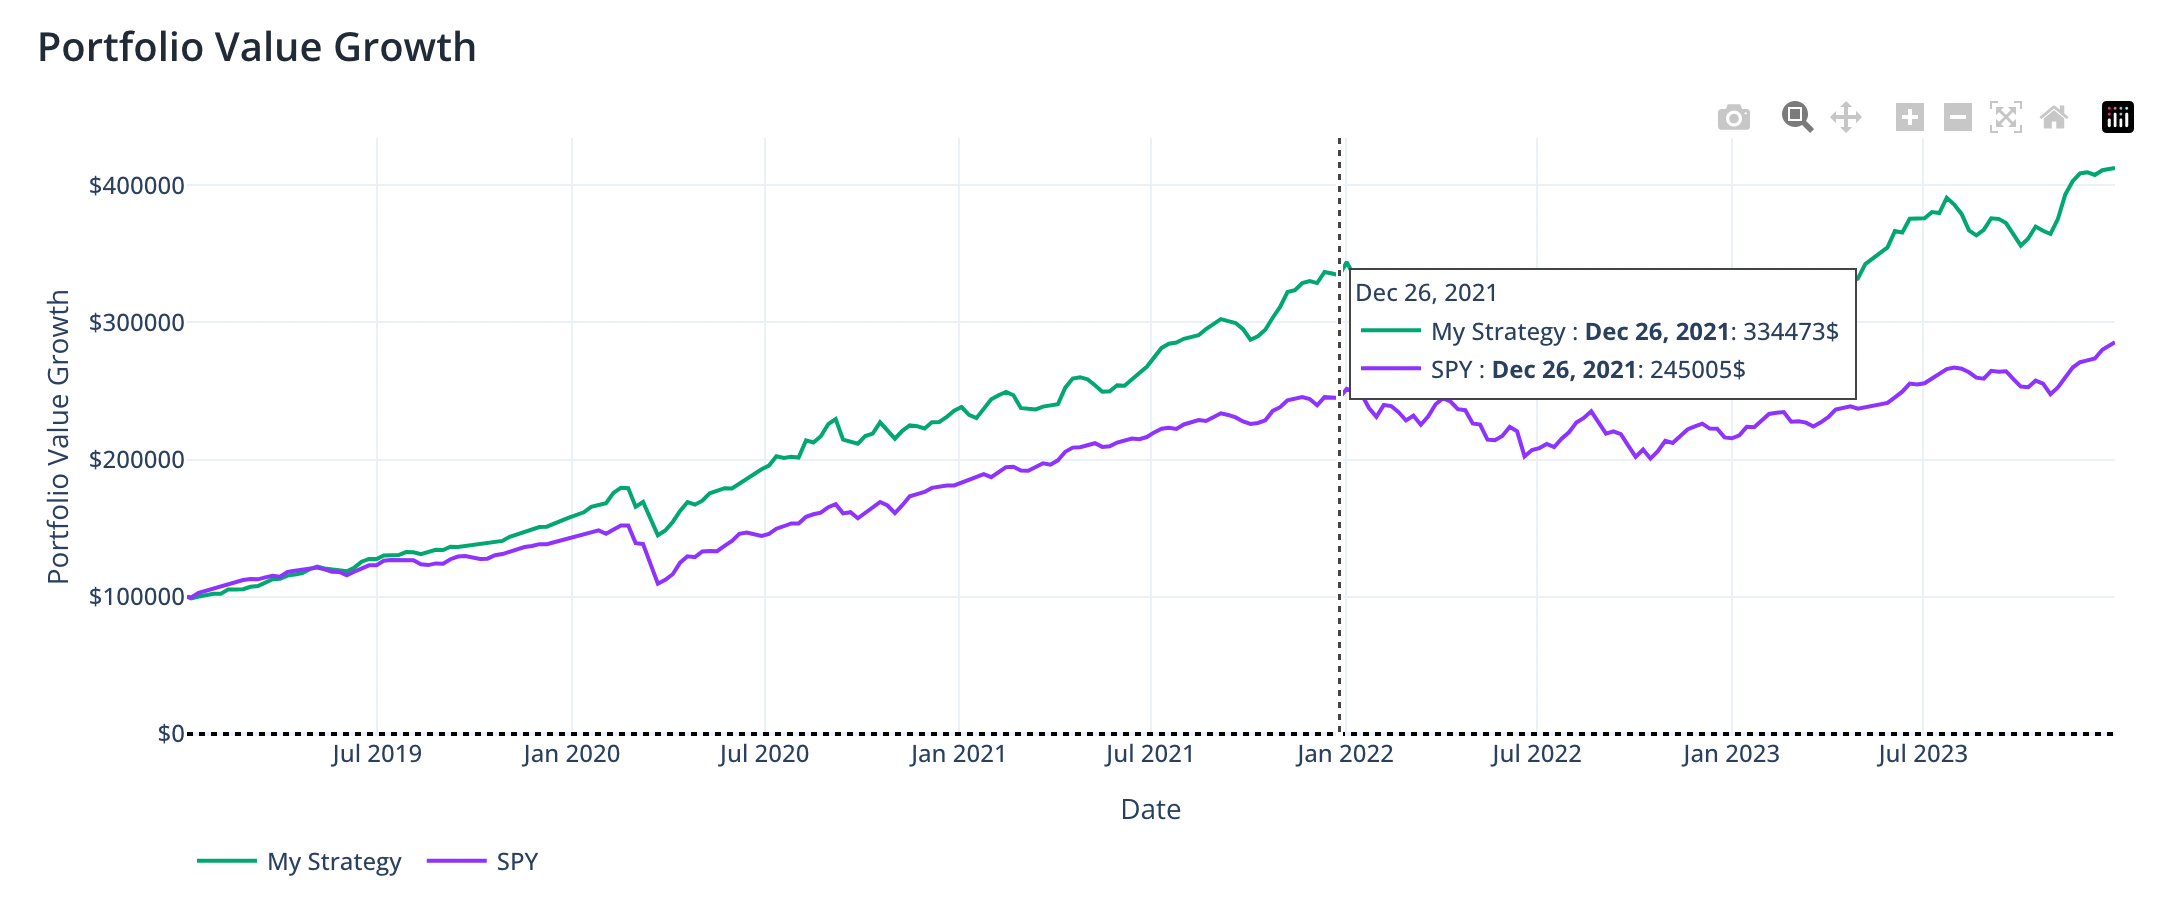
Based on user feedback, we’ve introduced the Portfolio Value Growth Analysis. This feature allows you to see how your portfolio's value changes over time, taking into account initial portfolio value and cash flow scenarios, such as contributions or withdrawals, at regular intervals (yearly, quarterly, or monthly). Unlike our Performance Analysis, which displays data as returns, the Portfolio Value Growth Analysis shows the absolute portfolio value in USD or EUR. This is especially useful for understanding how your investment decisions affect your portfolio's growth.

Monte Carlo Simulation with Cash Flows
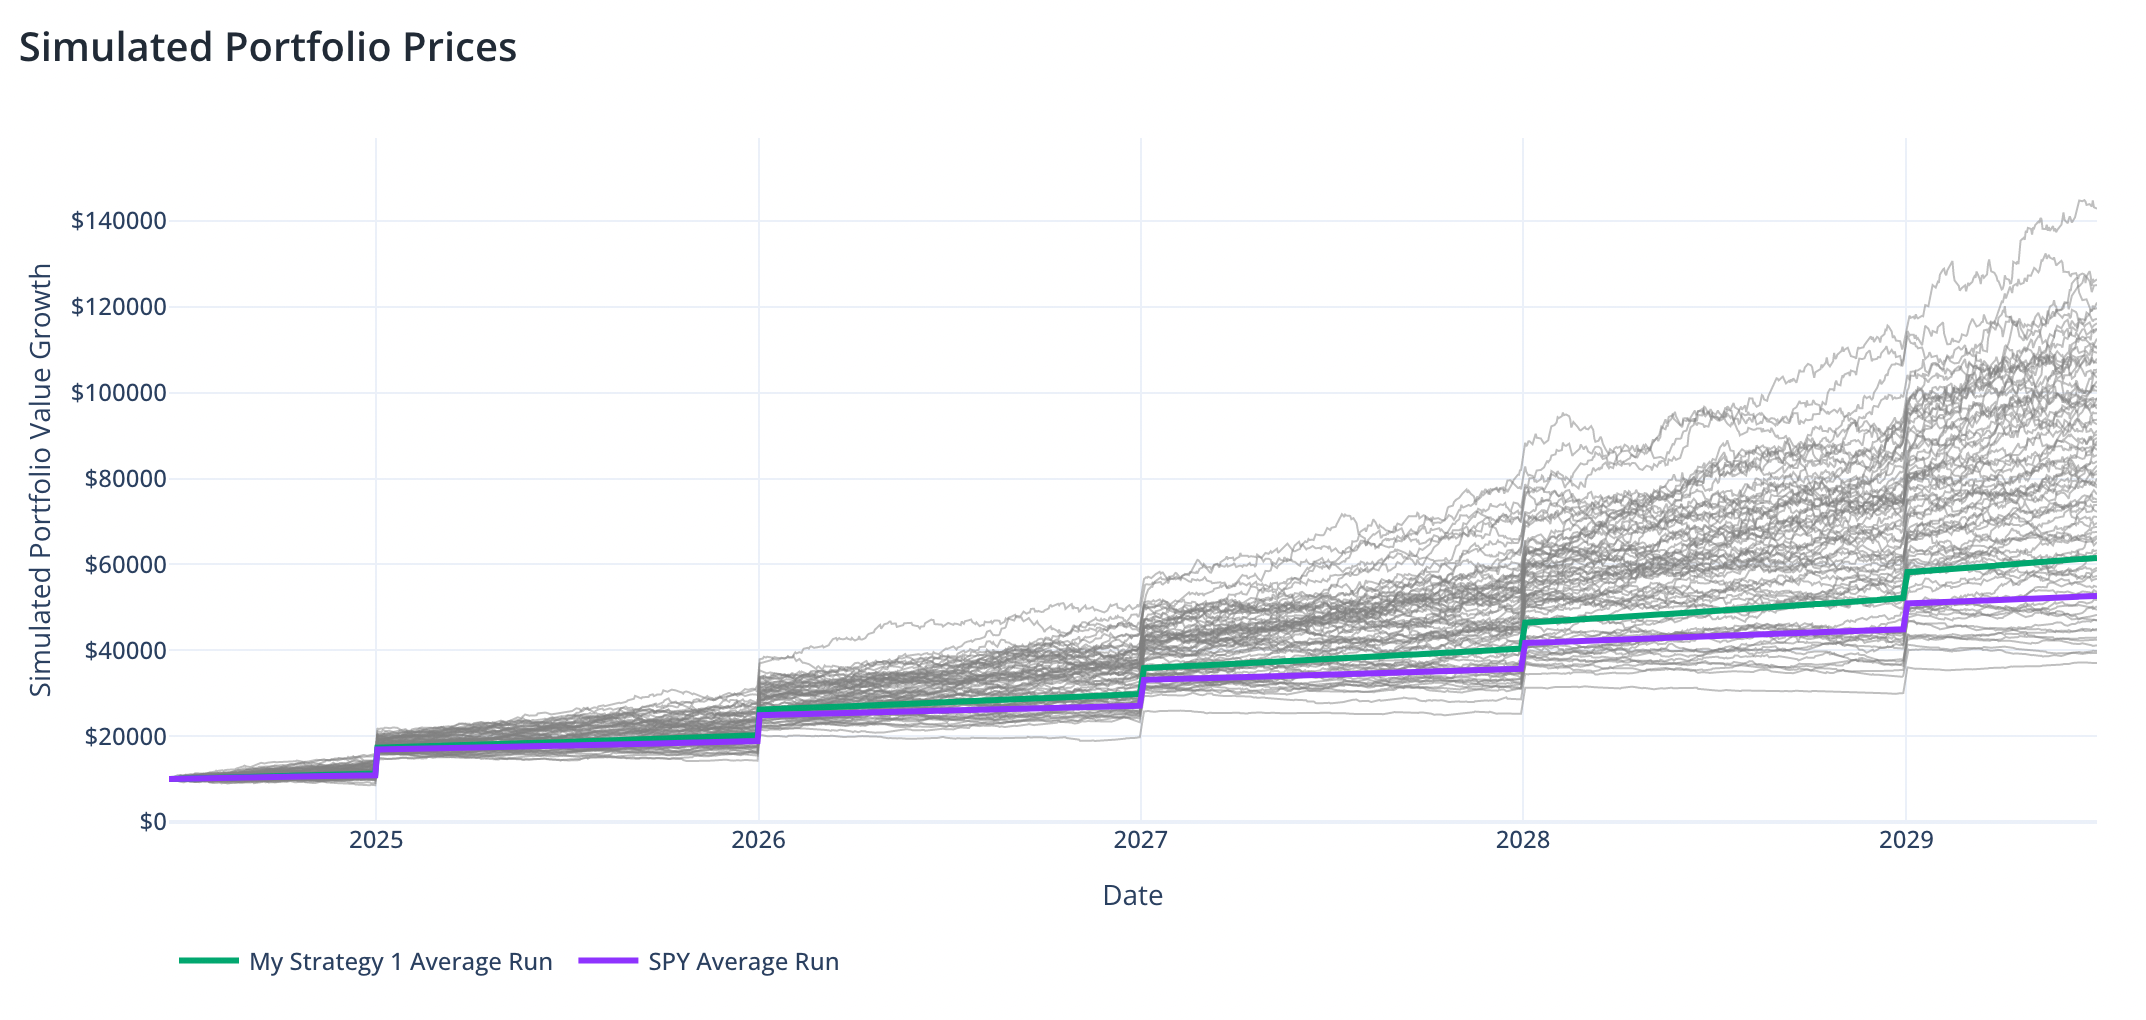
We've also enhanced our Monte Carlo Simulation to incorporate cash flows. This feature enables you to forecast future returns, accounting for initial portfolio values and additional cash flows ( contributions or withdrawals) in regular intervals. While the Portfolio Value Growth Analysis simulates cash flow strategies using historical data, Monte Carlo Simulation evaluates cash flows on the forecasted portfolio growth. You can now also select the number of forecast years, providing greater flexibility in scenario planning.

Important Note: The forecast generated through Monte Carlo simulations is purely hypothetical and does not guarantee future returns. Investment decisions should be made with consideration of various factors, and past performance is not indicative of future results.
Comparing Multiple Portfolios
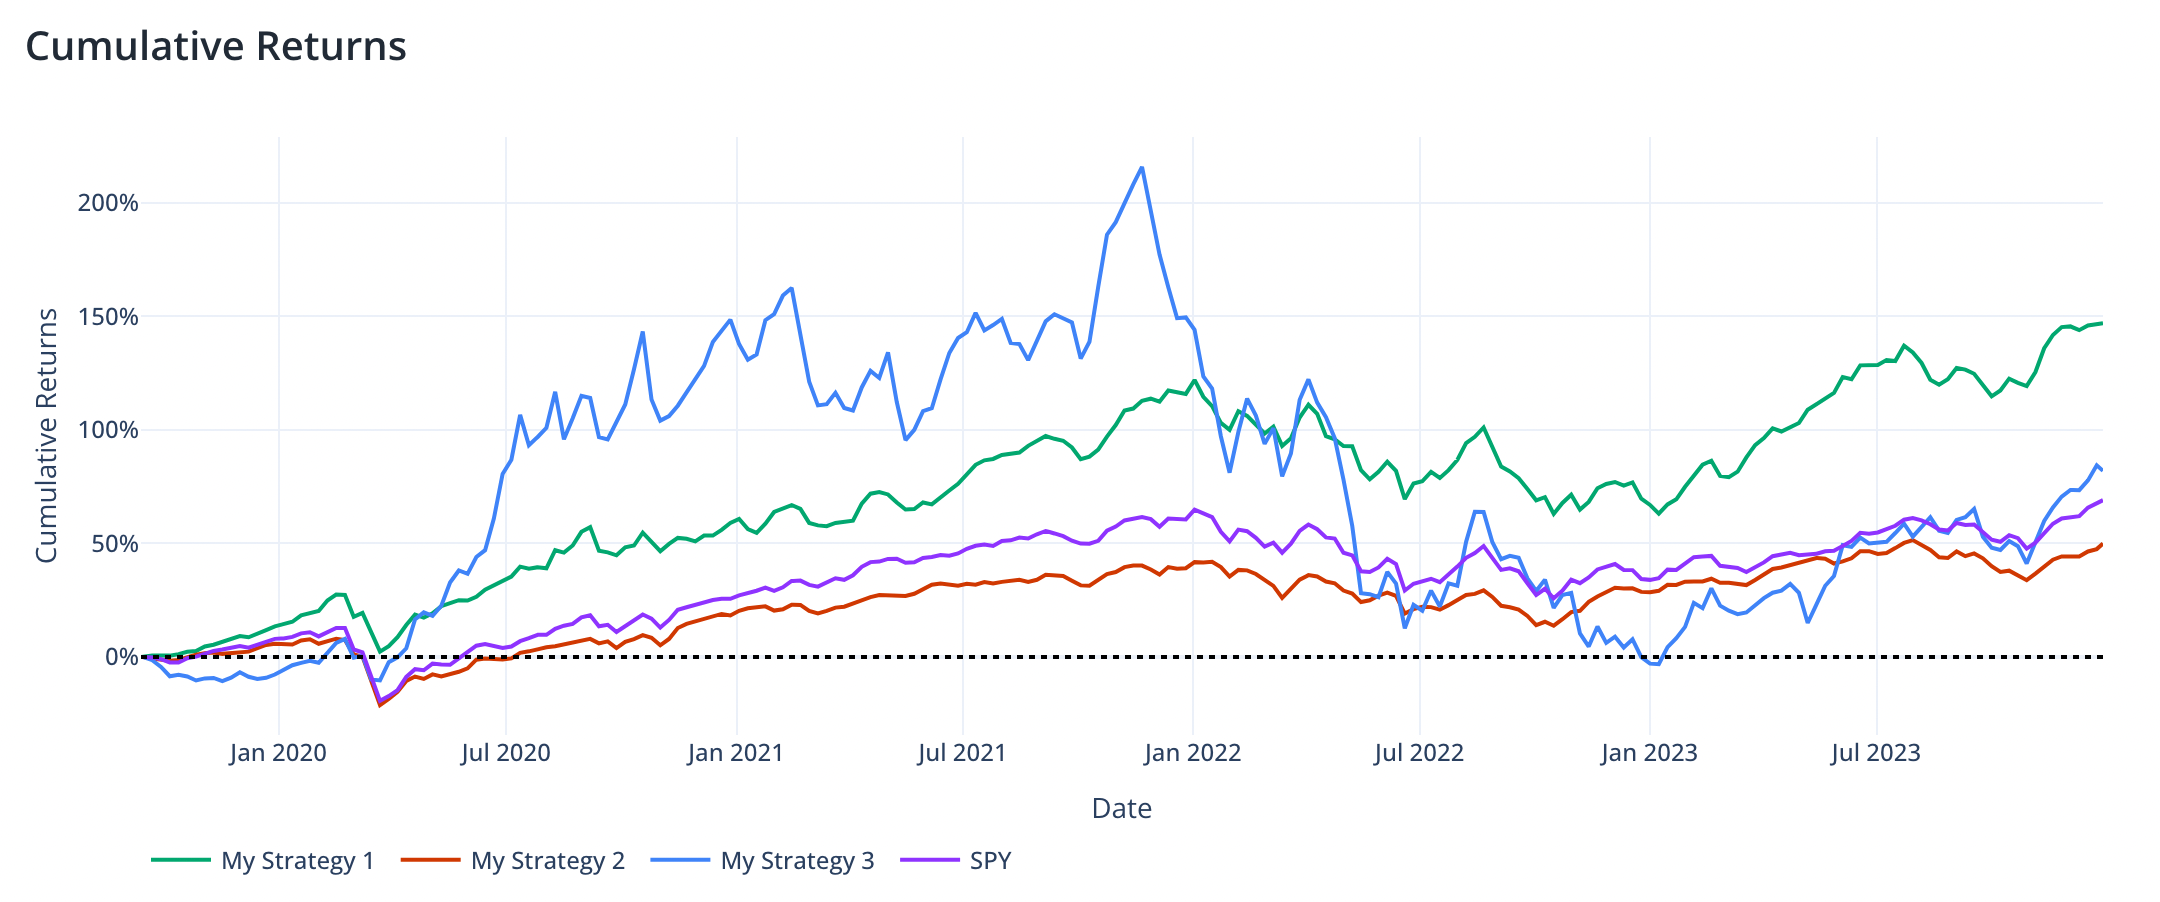
We've enhanced our reporting capabilities to process multiple portfolios in a single report, allowing you to compare up to three portfolios and one benchmark simultaneously. This feature is particularly useful when evaluating the performance of different portfolio strategies or cash flow scenarios side by side, making it easier to make informed investment decisions.

Faster Performance and Other Updates
User experience is a top priority for us, and we understand that waiting time can be a significant factor. To address this, we've implemented various performance optimizations to reduce the time required to generate reports. We've decreased computation time for our Efficient Frontier (Mean-Variance model) and Monte Carlo Simulation, as well as made other improvements to decrease latency, resulting in a decrease of several seconds per report. Currently, our largest bottleneck is loading the price data from third-party sources. These efforts ensure a smoother and more responsive experience for our users.
Additionally, we've introduced several other exciting features earlier this year, including:
- Save Reports: Save reports and access them later, reducing the need to input portfolio information multiple times.
- Share Reports: Share your reports with others using shareable URL links, facilitating collaboration and discussion.
- ETF Comparison: In addition to the main dashboard, you can now compare two Exchange-Traded Funds (ETFs) using our dedicated ETF comparison tool.
We are committed to continuously improving PortfolioMetrics and providing you with the best possible tools for managing and analyzing your investment portfolios. Stay tuned for more exciting updates in the future!